Are Dashboards Dead in the Age of Chat?
Are dashboards dead? How LLM-powered chat is transforming analytics from static screens into conversations—and where dashboards keep falling short.
Ask about this article
Opens Claude in a new tab to answer, using this article as the source.
How large-language models are transforming analytics from static screens to dynamic conversations
Today, Everyone agrees that data powers progress. It cuts surprises, clarifies choices, and drives alignment—but only if it’s shared.
Data Matters, But Access Matters More
Here’s the snag: too often, data sits trapped inside software rather than flowing freely across teams. Fewer than 20% of leaders believe they’ve built a true data culture. When insights hide behind complex tools or a handful of experts, momentum stalls. One team might wait days for answers. Another can’t trust reports, that they barely understand.
In short, data is only valuable when it’s accessible, top of mind, and steering decisions for an aligned team.
But before we can consider the next phase of data analytics, it’s important to understand how we got here.
The Hunter-Gatherer Era of Data
Dashboards promised quick answers but delivered a data jungle. They burst onto the scene with shiny charts and drag-and-drop tools. Demos made “instant insight” look easy. But once the software rolled out, people hit a wall. Unless reports came ready-made, getting information meant custom setups and confusing menus. Instead of instant clarity, workers began hunting and gathering data, a task only a few could master after long training.

Today, 84% of frontline staff call dashboards poor or hard to use, and employees spend 1.8 hours a day just chasing basic info.
This gap between flashy tools and real answers shows it’s time to rethink business analytics.
Where Dashboards Fall Short
Dashboards were a necessary first step away from static spreadsheets. They centralized metrics and gave analysts new superpowers. But three structural cracks appeared:
- The Endless Search
Complex filters and hidden metrics force employees into manual sifting or into analysts’ queues. - Data Islands
Departments own separate dashboards. Conflicting numbers spread doubt, and disconnected data islands cost businesses $3.1 trillion every year. - Frozen Insights
51% of users still can’t interact meaningfully with their data; 37% say insights aren’t actionable; 36% say updates are too slow to act on.⁴ Dashboards become digital wallpaper.
The result? 69% of office workers feel fatigued by workplace systems, sapping both productivity and morale.
Opening the Data Front Door
Dashboards aren’t worthless; they’re just not the destination. Power users still need deep dives, trend lines, audit trails, and pixel-perfect charts. Think of dashboards as the analytics back room: crucial for stocking the shelves, but no place for a quick shopper. To serve the rest of the team, we need a bright, hassle-free front door that hands out answers in seconds.
Fortunately, with the advent of LLMs, that shift is not just possible, it’s here.
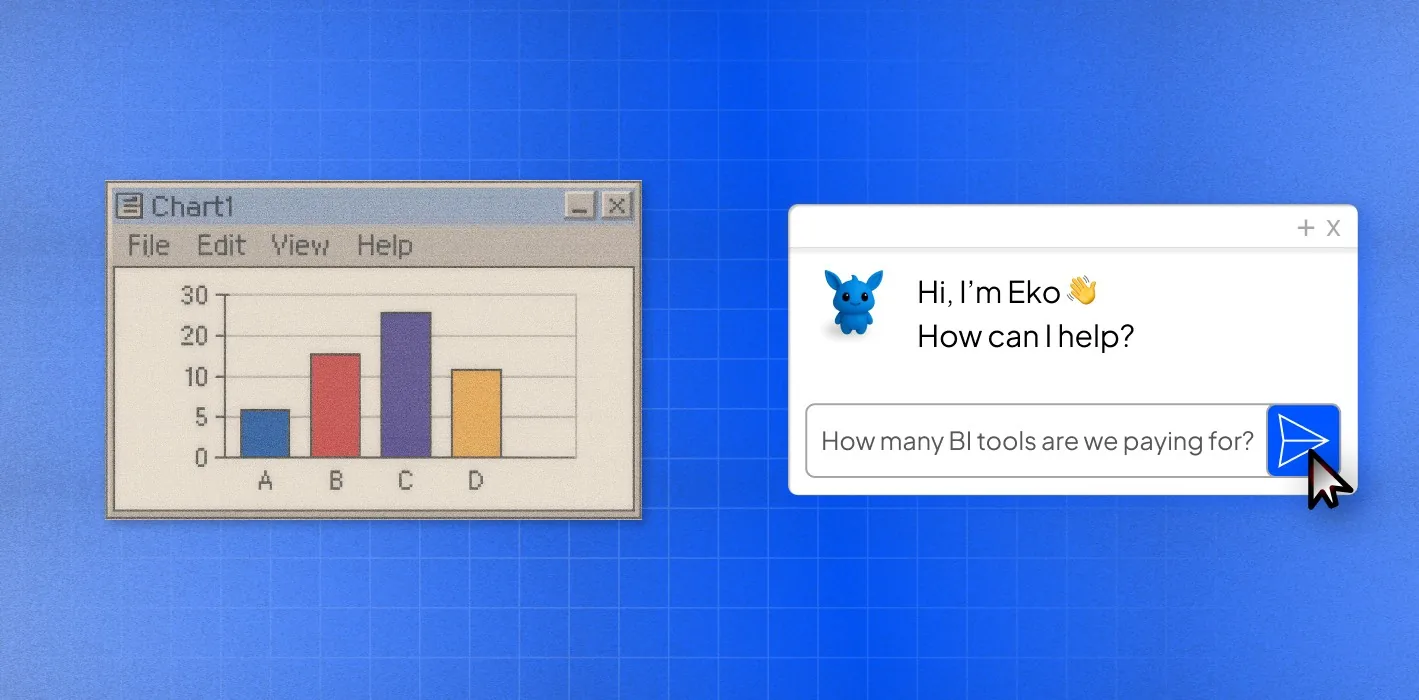
Chat: The Old/New Interface for Data
Large-language models now translate plain speech into precise API calls, so a question like “Which SaaS contracts renew next quarter?” is compiled, filtered, and answered faster than an analyst could open the first dashboard tab.
This shift replaces layered menus with an interface every employee already knows: language. It frees you to focus on what to ask, rather than how to navigate.
More importantly, this conversational layer creates a shared reality across teams. Too often, siloed teams have siloed realities based on different data threads. With a chat interface, every team can query the same datasets. Alignment will still take work, but it has a better chance of success when working from the same numbers.
Finally, the same thread that delivers insight can queue action: approve a renewal, spin up a workflow, or schedule a follow-up analysis with a single prompt. Insight and execution merge into one continuous loop, turning conversation into the primary control surface for modern analytics.
In short, chat-based interfaces bring three big advantages:
- Easy for anyone to use
- Better alignment over shared data
- Faster transitions from insight to action
Building the Bridge: Three Pillars
A conversational interface feels deceptively simple (type a question, get an answer), but it stands on serious engineering. To move a company from “dashboard-driven” to “dialog-driven,” the platform must excel in three areas that reinforce one another like girders in a bridge. Miss one and the span sags; get all three right and data flows smoothly from raw tables to decisive action.
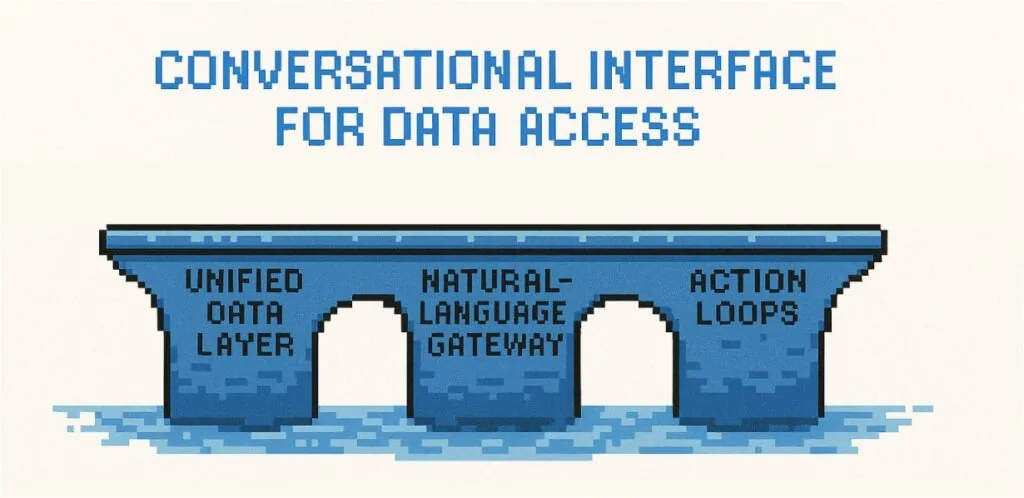
1. Unified Data Layer
A single semantic model beats prettier charts every time. When finance, CRM, and ops data live behind one API, every query draws from the same definitions, joins, and permissions. Analysts stop reconciling “sales” versus “revenue” columns, and business users stop emailing CSVs. The result is fewer trust gaps and faster iteration on metrics that actually matter.
2. Natural-Language Gateway
The interface should conform to the user, not the other way around. Whether the prompt arrives by chat, voice, or an SDK call, the same parsing layer should convert intent into secure SQL, DAX, or Spark without manual babysitting. This lets analysts focus on modeling and optimization while everyone else engages through the channel that feels most natural.
3. Action Loops
Insight without follow-through is shelfware. Each answer should surface contextual “next steps”: trigger a Slack approval, open a JIRA ticket, or launch a renewal workflow, straight from the chat thread. Embedding these automations closes the gap between knowing and doing, turning the interface into a true control plane for business processes.
For example, at Torii, we’ve developed a chat-based interface and AI assistant called Eko. Rather than a simple chatbot, Eko embodies this shift towards democratized access to SaaS insights.
Case Study: Why Torii Built Eko
Background & Challenge
Torii’s platform unified SaaS spend and usage data, yet every day, stakeholders like finance, security, and procurement still pinged their IT counterparts for basics like “Who owns Zoom?”
Some organizations didn’t even know that their company had a SaaS Management Platform or that this information had a single source of truth. Torii developed a series of custom dashboards that were powerful, but their adoption was limited to existing users. Essentially, the rest of the company still didn’t feel empowered to get the data.
Solution: Eko, the Chat-Based Interface
Torii built Eko as the conversational front door to its data set. Powered by large-language models and Torii’s unified semantic layer, Eko interprets any plain-language prompt and routes it to the right AI agent to assist. No menus, no macros.
Today, Eko has five seamless agent modes:
| Agent Mode | What It Delivers | Typical Questions |
| Smart Support | Context-aware answers drawn from Torii’s product docs | “How do I add Okta as an SSO source?” |
| Quick Answers | Instant facts from spend & inventory tables | “How much are we paying for Microsoft 365?” |
| Advanced Insights | Multi-step queries with filters & joins | “List apps with contracts ending in 90 days.” |
| SaaS Management Coach | Best-practice guidance & workflow advice | “Which tasks should I add to our off-boarding runbook?” |
| Deep Learning | Open-ended, back-and-forth exploration across cost, risk, and usage | “Show me potential security gaps and the cheapest ways to close them.” |
Eko auto-detects intent and switches agents on the fly, so users experience one fluid conversation rather than a menu of tools.
The Results: Complement, Not Replace Dashboards
Eko hasn’t replaced dashboards; it has widened the doorway. The chat interface draws first-time Torii users, often from finance, security, and procurement, who find plain-language queries less daunting than charts. Meanwhile, veteran IT admins still learn on dashboards for deep dives and trend work. The result is additive: new teams rely on Eko for fast answers, and power users keep their familiar workspace in addition to Eko.
Conclusion
Dashboards helped us on the journey, but they were never the destination. To move faster now, we need a front door everyone can access—one where a plain-language question pulls the right numbers and tees up the next action. Chat-based analytics delivers that doorway, turning conversation into the mechanism to enable a data culture for modern workplaces.
Practical Next Steps
- Pilot, learn, expand – Start with a single high-value use case, refine based on feedback, then roll out company-wide.
- Catalog your data – List every app, database, and file that stores key metrics.
- Mark what matters – Highlight the figures that steer daily and quarterly decisions.
- Decide buy vs. build – Evaluate whether to assemble your own stack or adopt an off-the-shelf platform.
- Choose automation-ready tools – Look at options like Torii’s Eko, which pairs conversational analysis with powerful workflows and automation.