The Role of SaaS Management in Reducing Shadow IT in 2026

Shadow apps slip into the stack. Someone clicks “Sign in with Google,” starts a free trial, puts it on the company card, and moves on. Security gaps appear, costs rise, and reporting falls short.
SaaS management platforms pull together SSO logs, packet traces, browser events, and finance data. They turn authentication logs, TLS fingerprints, and merchant codes into usable inventory, then map activity for every seat. The result is clear evidence of what’s running, who’s paying, and how each tool performs.
This guide breaks down that workflow so your team can spot, quantify, and retire shadow SaaS before it drains cash or adds risk.
Table of Contents
- Surface every app with SSO logs
- Spot rogue tools via web traffic
- Trace spend clues in finance data
- Turn app lists into usage insights
- Share one dashboard across teams
- Act on findings with clear playbooks
- Conclusion
- Audit your company's SaaS usage today
Surface every app with SSO logs
SSO logs tell the truth about app sprawl. A SaaS management platform plugs into the audit APIs in Okta, Azure AD, or Google Workspace and streams sign-in events almost as they happen. Each event lists issuer, audience, client ID, scopes, and timestamps. The platform combines those fields, adds HRIS group data, and builds an inventory that refreshes every time someone clicks “Sign in with Google.”
SAML responses supply the service provider entity ID; OIDC tokens call out redirect URIs and granted scopes. That mix reveals who invited the tool, which department owns it, and how the app requests access. Older events round out the story. A 12-month lookback surfaces one-off initiatives and shows if anyone still logs in. No activity for 90 days sends the record to a dormant queue and marks it for license recovery.
- Parse SAML
DestinationandAudienceto spot multi-tenant apps hiding behind shared domains. - Inspect OIDC
scopestrings for risky grants such asoffline_access. - Pull SCIM provisioning status to learn if accounts can be shut off automatically.
- Capture
userAgentdetails to separate browser from mobile sessions. - Cap daily log pulls to the minimum fields needed and meet least-privilege goals.
Granular API scopes keep legal and security teams relaxed. Google’s Reports API, for example, can return only login activities without touching Gmail. Start read-only, test in a sandbox tenant, then widen as evidence gaps appear.
Gartner estimates the average company runs 335 SaaS apps, yet most IT teams see fewer than 200 in their spreadsheets. Hard data like that grounds every later step in the rationalization process.

Spot rogue tools via web traffic
Network data rarely lies. Unsanctioned SaaS, including Shadow AI, shows up as new domains, odd TLS handshakes, and sudden outbound traffic spikes. A packet mirror on the core switch or a feed from the secure web gateway is usually the first hint, but raw data alone can bury an analyst. After the initial capture comes pattern matching. Finance dashboards shouldn’t talk to Dropbox, and a design workstation has no reason to ping Salesforce. Feed DNS queries, JA3 fingerprints, and HTTP host headers into a rules engine, then score each hit by how unusual it is internally and how often it lands on open-source threat lists.
Secure web gateway vendors such as Zscaler publish APIs that stream log events in near real time. Pull the feed into the SaaS management platform, hash the IP and user fields, and join the stream with HR tables so privacy holds. Machine learning can sort the leftovers, yet a simple whitelist knock-out often reveals 70 percent of shadow apps in the first week.
Desktop apps often dodge proxies by using direct TLS. A broker at the span port (for example, Cloudflare Magic Firewall in mirror mode) grabs certificates, which carry the same base domain the vendor’s web app uses. Match that CN against your library of 30,000 SaaS domains and Figma, Zoom, or Notion appears in desktop form without an agent.
Teams on hotel Wi-Fi need a different trick. A lightweight browser add-on, pushed with Chrome Enterprise policy, records visited domains plus the window title. The extension sends hashed URLs every five minutes, small enough to preserve battery and patience. Remote usage feeds the same analyzer, giving the company parity with office traffic.
Key setup tasks stay repeatable when documented:
- Select one mirror point per network segment to prevent duplicate packets
- Forward logs in JSON to avoid custom parsers
- Mask user identifiers at ingestion, not display time
- Rotate detection rules monthly so risk scores stay fresh
With these streams running, unsanctioned SaaS collapses into a tidy list of root domains, risk levels, and hosts. The business can choose to allow, watch, or block each one.

Trace spend clues in finance data
Card statements tell the story. A $19 charge to Figma, a $299 Stripe invoice tagged “consulting,” ten scattered Zoom renewals at list price. Each line hints that an app slipped past security and procurement.
Start by wiring your SaaS management platform to the systems that see spend first: ERP, AP, and corporate card feeds. NetSuite, Brex, and SAP Concur all expose APIs that stream cleared transactions every few minutes. Pull those records and run matching logic against a SaaS vendor library. The library needs every alias a vendor uses: “MSFT,” “Microsoft Online,” “O365,” even “Softype.” Solid matching prevents the “unknown merchant” bucket from ballooning.
Once you have matches, add context. Who owns the cost center? Look for renewal dates hidden in the invoice memo. Finance tags help because they map cardholders to departments. When a product shows both marketing and sales cards, that points to overlap and likely waste.
Small charges add up. Gartner puts rogue SaaS spend at 15 percent of the cloud budget. Set alert rules that trigger when:
- Monthly spend rises more than 20 percent without a purchase order
- A new merchant code 5734 (computer software) appears
- A contract renews above the negotiated rate
The alerts feed Slack or Jira tickets so owners can justify or cancel.
Pull license counts next. Many vendors embed seats right in the invoice. Combine that with the spend field to produce cost per seat today, not at last QBR. If the number beats your internal benchmark, it moves to the “review” column. Contract terms matter too. Auto-renewal clauses shorter than 30 days cut negotiation power, so flag them early.
Finish with a rolling dashboard that shows top ten uncategorized vendors, expiring renewals in 60 days, and cumulative savings won. Teams that follow this playbook often reclaim 25 percent of hidden SaaS spend in the first quarter while clearing audit gaps that used to surface only during year-end close.

Turn app lists into usage insights
Inactive licenses drain budgets. You already have the proof.
Vendor APIs and lightweight browser events push raw numbers into the SaaS management platform every hour. The feed shows who clicked what, when, and for how long. Join that trail to the contract file and you end up with two clear columns: seats paid, seats active. If 40 of 120 Figma accounts stay idle for 30 days, or a similar number for Grammarly active users, the ratio tells the story without another dashboard.
Turn those rows into action by putting usage, risk, and value on one scorecard. Put each metric on a 0-100 scale so the worst tools bubble up when you sort. A cheap, low-risk app can live with weak adoption, while an expensive, high-risk one with the same usage gets cut quickly. Framing the data this way keeps the review from sliding into a gut-feel argument.
- Active-seat rate: monthly active users ÷ total licensed seats
- Feature depth: advanced feature calls ÷ total sessions
- Session minutes per user: total time in app ÷ active users
- Cost per active seat: monthly spend ÷ active users
- Overlap index: shared users between peer apps ÷ total peer users
Cross-app overlap exposes silent waste. When 87 percent of Slack users also open Microsoft Teams each day, you can drop one chat tool or at least shrink the seat tiers. The same check works on storage, CRMs, even design suites.
Pull the numbers into a live worksheet, sort by cost per active seat, and flag anything above the median. Open the finance tab and link each flagged tool to its budget owner. Send a short note with the scorecard attached. Clear data usually brings a decision within a day.
Flexera’s 2023 survey says companies let about 18 percent of SaaS spend sit idle. Halve that waste and you claw back roughly nine percent, no vendor negotiations required. Run the review every quarter and the platform will trace the gains, giving leadership a simple graph: seats saved, dollars back, risk down.

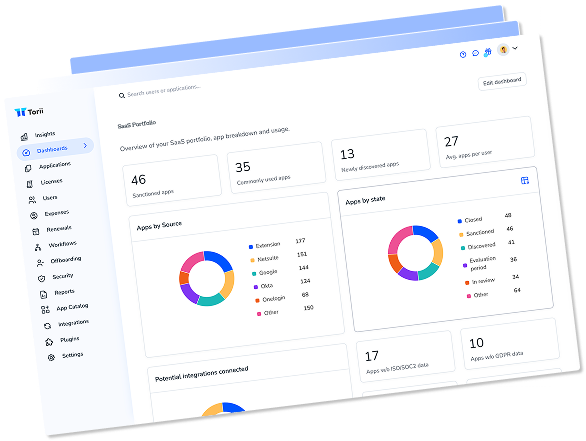
Share one dashboard across teams
A single view that combines inventory, spend, and risk turns daily decisions from guesswork into evidence. Teams no longer bounce between spreadsheets and point tools because the data lives in one place and updates on its own.
The setup starts with a time-series store. Every app, user, and dollar drops into a table keyed by date. The dashboard then publishes the slices each team cares about.
- IT: live app count, new domains in the last 24 hours, open tickets by severity
- Security: OAuth scopes, data-at-rest location, MFA status, vendor breach history
- Finance: monthly run rate, upcoming renewals, cost per active seat
- Business leads: feature adoption trend, satisfaction poll score, owner contact
Filters let a security analyst zero in on apps that write to Google Drive while a finance partner checks which of those overlap with expiring contracts. Each view follows the role rules in the identity provider so a marketing manager never sees payroll tools, and audit logs still record every click.
The same objects travel outward. A webhook streams high-risk findings to ServiceNow as incidents. A JSON feed tags new apps in Splunk so correlation rules trigger right away. Jira gets a weekly batch of “right-size seats” tickets, already filled with license counts and owners.
Numbers keep everyone honest. Consistent metrics surface growth rates, redundant contracts, and unmanaged risks without extra standing meetings.
Set the review cadence. Boards usually ask for a three-slide export: top ten spenders, top ten risks, and savings realized. The platform emails the deck each month, then resets the targets. Small feedback loops turn into habits. When users know their app will appear on the dashboard tomorrow, they think twice before swiping a card without approval.
Central data, clear roles, steady feedback. That trio keeps shadow IT from creeping back.

Act on findings with clear playbooks
Shadow IT insights get dusty fast if nobody acts. Assign an owner to each uncovered app; without a ticket, it slips through the cracks. A quick email template makes outreach painless:
- App name, risk score, and renewal date in the subject line
- Single-sentence note on overlap or compliance gap
- What needs to happen and by when
Numbers usually get a reply within a day. If the team is big, grab 15 minutes, show one slide with usage, cost, and security rating side by side. When Slack, Teams, and Zoom all handle chat, calling out the $28-per-seat swing speeds the decision.
Automation keeps things moving. Send discovery alerts to Jira or ServiceNow and tag the right cost center from your finance feed. Close the ticket automatically after the app shifts behind SSO in Okta or the license count drops. Blocking is the last resort: have the CASB quarantine the risky domain only, so regular work isn’t interrupted.
Build lightweight policies that fit on one page:
- Post a business case in the spend channel before buying new SaaS
- Contracts must cover data-at-rest encryption and yearly pen-test results
- Kick-off renewals 90 days out with a cost-per-active-user target
The rules live in the same dashboard that flags violations. If no one can find a policy, no one will follow it.
Measure success weekly. Track:
- Licenses reclaimed
- Dollars saved versus last quarter
- Average time from detection to closure
Small wins snowball. Results like that keep security, finance, and IT pulling in the same direction instead of meeting all day.

Conclusion
SSO logs show which apps people open. Network and browser data surface the tools that never went through single sign-on. Accounting records reveal low-profile subscriptions sitting on company cards. When you layer on usage metrics, it’s easy to rank each platform by activity and cost and know where to focus first. A single dashboard lets IT, security, finance, and business owners see the same facts and send follow-up actions straight into their own systems. Prebuilt playbooks for vendor outreach, license cleanups, and policy updates keep the project moving and tally the savings.
Pull all of that data together, and the shadow IT footprint shrinks while the value of every license goes up.

Audit your company’s SaaS usage today
If you’re interested in learning more about SaaS Management, let us know. Torii’s SaaS Management Platform can help you:
- Find hidden apps: Use AI to scan your entire company for unauthorized apps. Happens in real-time and is constantly running in the background.
- Cut costs: Save money by removing unused licenses and duplicate tools.
- Implement IT automation: Automate your IT tasks to save time and reduce errors - like offboarding and onboarding automation.
- Get contract renewal alerts: Ensure you don’t miss important contract renewals.
Torii is the industry’s first all-in-one SaaS Management Platform, providing a single source of truth across Finance, IT, and Security.
Learn more by visiting Torii.
Frequently Asked Questions
Shadow apps are unauthorized software applications used within a company, often initiated by employees bypassing formal procurement processes, leading to security risks and inflated costs.
SSO logs provide detailed sign-in events that highlight app usage, revealing unauthorized applications and allowing you to maintain accurate inventory and mitigate risks.
Network data uncovers each application's web traffic, revealing unauthorized SaaS through unusual domains, TLS handshakes, and traffic spikes that suggest app sprawl.
Finance data helps identify unexpected charges and track spending patterns across various applications, enabling better budget management and cost control for SaaS tools.
Usage metrics provide valuable insights into license activity, distinguishing between active and inactive licenses, helping to determine cost-effectiveness and application necessity.
A central dashboard consolidates data across IT, security, and finance, streamlining decision-making by providing real-time visibility into application inventory, spending, and risks.
Organizations should create clear playbooks and assign ownership to each discovered application, ensuring timely action and compliance with established policies to manage shadow IT.