4 Ways to Monitor User Activity in Salesforce in 2026

You log in each morning hoping your org hums along quietly, but a lot can happen behind the scenes. Users tweak records, run reports, maybe download data, all before coffee.
Knowing who did what, and when, is key to security, compliance, and coaching. We’ll break down four practical ways to watch user activity in Salesforce so you can catch risks early, spot adoption trends, and back every admin call with hard data.
Table of Contents
Use Salesforce’s UI
This walkthrough shows how to watch logins, setup changes, and field edits in the Salesforce UI so small problems never snowball.
Open Setup and Find Login History
- Click the gear icon.
- Select Setup.
- In Quick Find, type Login History.
- Choose Login History under Users.
- Scan the table for odd hours, unknown IP addresses, or repeated failures. Salesforce keeps the most recent 20,000 logins right here.
- Need deeper digging? Click Download to pull a CSV of the last six months, as outlined in Salesforce’s “Monitor Login History” help doc.
Check the Setup Audit Trail
- Still in Setup, type View Setup Audit Trail into Quick Find.
- Open View Setup Audit Trail.
- The list shows the last 20,000 configuration changes, covering items from new permission sets to deleted custom fields.
- Click Download to grab a CSV of the past 180 days if you prefer a spreadsheet view. Salesforce’s “Track Changes with Setup Audit Trail” doc confirms the 180-day limit.
Turn On and Read Field History Tracking
- Go to Object Manager.
- Pick the object you care about, like Account or Opportunity.
- Select Fields & Relationships → Set History Tracking.
- Check Enable and select up to 20 fields.
- Save.
- Users with the right permissions can now open a record, look for the History related list, and see who changed each tracked field and when.
(Optional) Use Event Monitoring in Setup
- If you have Event Monitoring licenses, type Event Monitoring Analytics in Quick Find.
- Open it and pick an app such as Login Analytics.
- Dashboards highlight top users, IP locations, and session lengths.
- For custom views, clone a dashboard, tweak filters, and save.
Build a Simple User Login Report
- From the App Launcher, switch to Reports.
- Click New Report → select Users.
- Add columns like Last Login and Active.
- Filter Last Login to “not equal” blank to see everyone who’s logged in.
- Save, name, and share the report with admins or managers who need a quick pulse check.
Combine Login History, Setup Audit Trail, Field History Tracking, and Event Monitoring to keep a clear record of who did what, when, and from where without ever leaving Salesforce.
Use Torii
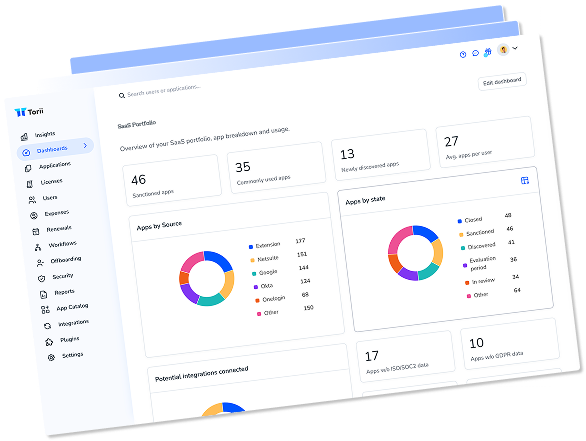
Skip the manual checks in Salesforce and plug Torii into your stack instead. The SaaS Management Platform pulls data from every cloud tool you pay for and shows it all on one clear dashboard.
To see Salesforce user activity inside Torii, follow these steps:
1. Create a Torii account
Contact Torii to spin up a free two-week proof-of-concept.
2. Link Salesforce to Torii
Once your Torii workspace is live, hook up your current Salesforce instance. Follow the official guide: Salesforce integration instructions.
3. Locate Salesforce inside Torii
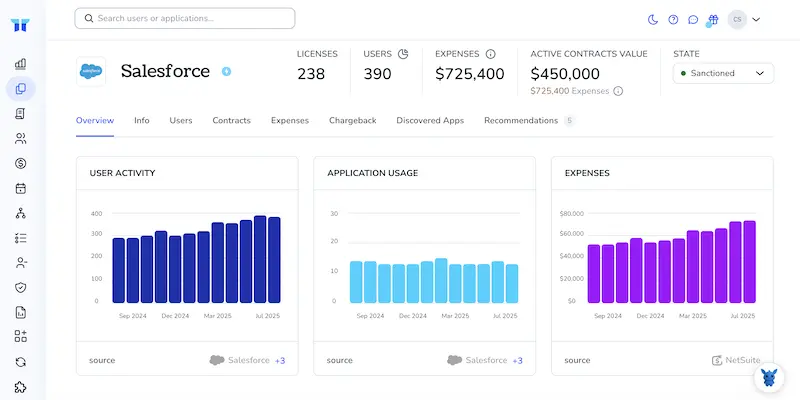
Use the search bar at the top of the Torii dashboard to find Salesforce. On the Salesforce overview page you’ll see license counts, total spend, upcoming renewal dates, and other key details at a glance.
Or, chat with Eko
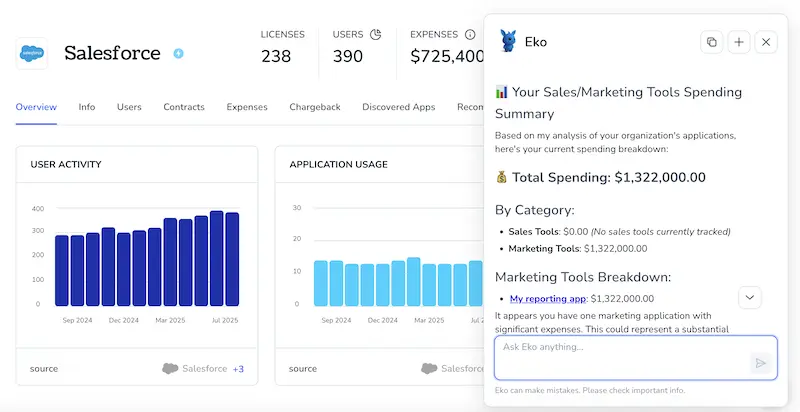
With Torii’s AI helper, Eko, you can pull Salesforce details without leaving the platform.
Click the Eko button in the lower-right corner of your dashboard, request the data you need, and the chat panel quickly returns the results.
Use Salesforce’s API
Here you’ll grab real-time user activity straight from Salesforce using the Event Monitoring REST endpoints.
Step 1: Get an OAuth access token
Send a POST request to Salesforce’s /services/oauth2/token endpoint.
curl https://login.salesforce.com/services/oauth2/token \
-D "grant_type=password" \
-D "client_id=YOUR_CONSUMER_KEY" \
-D "client_secret=YOUR_CONSUMER_SECRET" \
-D "username=YOUR_USERNAME" \
-D "password=YOUR_PASSWORD"
Copy the access_token value from the JSON response. You’ll pass it in every call that follows.
Step 2: Find today’s event log files
Event data lives in the EventLogFile object, so ask for what’s available.
curl https://your_instance.salesforce.com/services/data/v58.0/query \
-H "Authorization: Bearer ACCESS_TOKEN" \
-H "Content-Type: application/json" \
-G --data-urlencode "q=SELECT Id, EventType, LogDate, LogFileLength, LogFile, LogFileContentType FROM EventLogFile WHERE LogDate = TODAY"
Key fields to note:
Id: internal record IDEventType: Login, API, Aura, etc.LogFile: link used to download the fileLogFileLength: byte size, useful for sanity checks
Step 3: Download a specific log file
Pick the row that matches the event you need (for user activity, Login and API are common). Use the LogFile value.
curl https://your_instance.salesforce.com/LOG_FILE_PATH_FROM_QUERY \
-H "Authorization: Bearer ACCESS_TOKEN" \
-O login_events.csv
The file arrives as CSV inside a ZIP. Unzip it with any standard tool.
Step 4: Parse the CSV for user actions
Each row is one event. Important columns:
USER_ID: Salesforce user IDEVENT_TYPE: what happenedSESSION_KEY: groups actions under one sessionCLIENT_IP: source IP address
Filter or load the CSV into your data store, then roll up metrics like:
- Logins per user per day
- Failed logins (look for
LOGIN_FAILED) - API calls by integration user
Step 5: Automate the pull
- Schedule a job (cron, AWS Lambda, or similar) that repeats Steps 2-4 every few hours.
- Store the
LogDateof the last processed file so you only fetch new data. - Keep the access token fresh. Repeat Step 1 when it expires or use the refresh token flow.
Step 6: Keep the data for audits
Salesforce stores detailed event files for 30 days, or just 24 hours on some editions. Move the CSVs into long-term storage right after you download them so nothing slips away.
Use Claude (via MCP)
Some teams pull these details straight into Claude through the Model Context Protocol (MCP). Claude is Anthropic’s conversational AI assistant and an alternative to ChatGPT.
To let Claude track Salesforce activity in real time, do the following:
1. Connect Torii
Finish the earlier Torii steps to connect your Salesforce instance to Torii.
2. Configure MCP in Claude
Check the official Torii MCP documentation along with this related blog post.
After installing the Claude Desktop app, add this block to claude_desktop_config.json:
{
    "mcpServers": {
        "Torii MCP": {
            "command": "env",
            "args": [
                "TORII_API_KEY=YOUR_API_KEY",
                "npx",
                "@toriihq/torii-mcp"
            ]
        }
    }
}
Create the API key in your Torii Settings and replace YOUR_API_KEY with the value you generate.
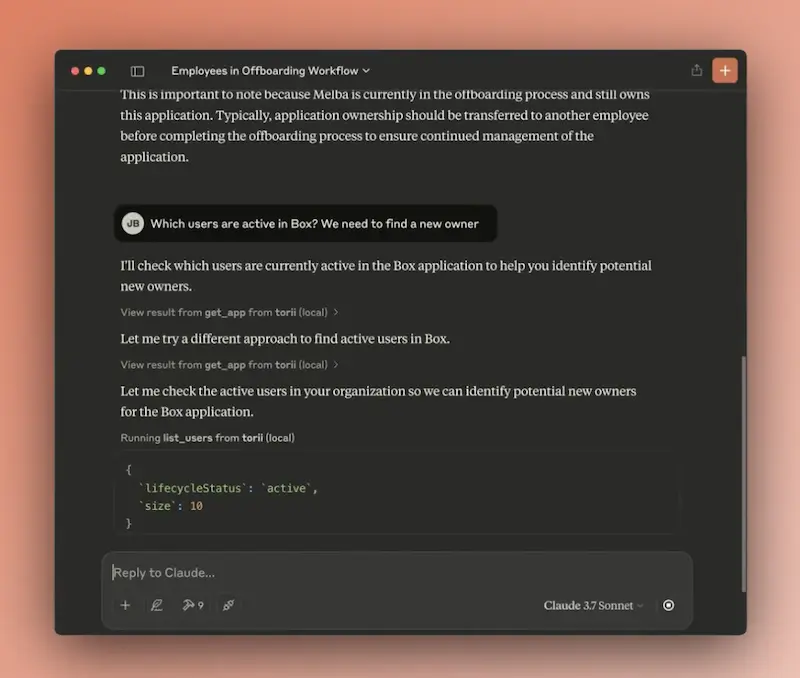
3. Start chatting with Claude
Once everything is set up, open Claude and chat with your Torii environment. Ask for insights such as the number of Salesforce licenses in use, total spend, upcoming renewal dates, and any other metrics you need.
Torii for SaaS Management
Looking to sharpen your SaaS management approach across the company? Let us know how we can help. With Torii’s SaaS Management Platform, you can gain immediate visibility and act on what you find:
- Reveal shadow IT: AI scans your environment around the clock and flags any unapproved apps as soon as they pop up.
- Reduce spend: Remove idle licenses and overlapping tools so budgets stop bleeding.
- Automate employee lifecycle tasks: Speed up onboarding, offboarding, and other daily IT chores, saving hours and cutting mistakes.
- Stay ahead of renewals: Get timely alerts that let you renegotiate, renew, or cancel contracts on your schedule.
Torii brings Finance, IT, and Security teams a single reliable view of every app in use.
Learn more at Torii.
Frequently Asked Questions
Use Salesforce's built-in tools, Torii, or the Event Monitoring API. Inside Salesforce, check Login History, Setup Audit Trail, and Field History Tracking. For deeper analytics plug the org into Torii, or call Event Monitoring REST endpoints for raw log files you can automate.
Login History lists the last 20,000 sign-ins, showing username, time, IP address, status, and client type. Scanning it lets admins flag suspicious hours, unfamiliar locations, or repeated failures, and the CSV export gives six months of additional detail.
The Setup Audit Trail table displays the most recent 20,000 configuration changes in-app and lets you download a CSV holding 180 days of history, so be sure to export regularly if you need a longer audit window.
Torii connects to Salesforce via API, pulls license counts, spend, renewals, and user-level activity into one dashboard, then uses AI assistant Eko to answer ad-hoc questions. This removes manual report digging and unifies visibility across every SaaS tool.
Event Monitoring REST endpoints let you query the EventLogFile object, download detailed CSV logs for actions like logins or API calls, and feed them into BI or security tools. Automating pulls gives near-real-time insight beyond what the UI offers.
Salesforce retains event monitoring files for only 30 days—sometimes just 24 hours on lower editions—so exporting them to external storage immediately preserves evidence for audits, forensic investigations, and trend analysis long after the platform deletes its originals.