

How to Monitor Claude Billing and Anthropic API Spending (3 Methods)
 Chris Shuptrine
•
Aug 25, 2026
•
10 min read
•
Updated August 25, 2026
Chris Shuptrine
•
Aug 25, 2026
•
10 min read
•
Updated August 25, 2026
Learn three ways to monitor Claude and Anthropic API spending: use the Claude Console, set spend limits, or query the Admin API. Avoid surprise charges in 2026.
Ask about this article
Opens Claude in a new tab to answer, using this article as the source.
Keeping tabs on Claude billing in your Anthropic account can save you from surprise charges and burned credits. It’s easy to lose track when multiple workspaces, API keys, and models run at once, and agentic workloads like Claude Code can consume tokens far faster than a chat interface. Model choice alone swings the rate by 5x: Anthropic lists Claude Opus 5 at $5 per million input tokens and $25 per million output tokens, against $1 and $5 for Claude Haiku 4.5.
I’ll walk you through three practical ways to read the Claude Console’s Usage and Cost pages, set spend limits, and query the Anthropic Admin API’s usage and cost endpoints directly so you don’t get hit with an unexpected charge. Teams that want this centralized across every AI tool can also see how Torii tracks Claude spend.
Table of Contents
- Use the Claude Console Usage and Cost Pages
- Use Torii for Automated Claude Spend Monitoring
- Query the Anthropic Admin API Usage and Cost Endpoints
Use the Claude Console Usage and Cost Pages
Here, you’ll use the Claude Console (platform.claude.com, formerly console.anthropic.com) to view, filter, and export usage and cost data so you can track Claude billing without touching the API.
Open the Usage page
- Sign in to the Claude Console and open the Usage page from the left sidebar.
- The page charts token consumption over time, which is the quickest place to spot a spike from a runaway script or an agent loop.
Open the Cost page for dollar amounts
- The Usage page shows tokens; the Cost page shows dollars. Open Cost to see spend charted over your selected date range.
- Use the group-by controls to break spend down by workspace, API key, or model. Scan for expensive models or specific days with big jumps. That shows where to look next.
- If your organization uses workspaces (for example one per team or environment), the workspace breakdown is the fastest way to attribute a spike to an owner.
Pick the date range and filters
- Use the date selector to choose recent days, the current month, or a custom range.
- If you want monthly reports, set the custom range to the billing period.
- Look at the top-line totals over your selected range to get a quick sense of where you stand.
Export detailed usage for analysis
- From the Usage or Cost page, use the export option to download a CSV of the data behind the chart.
- Load the CSV into a spreadsheet or BI tool for charts and internal reporting. Narrow the date range and grouping before exporting if you only need a slice of data.
Set spend limits so overruns stop themselves
- In the Console settings you can set organization spend limits, and each workspace can carry its own monthly spend limit. Anthropic’s workspace documentation is explicit about the hierarchy: “You can set workspace limits lower than (but not higher than) your organization’s limits” (source).
- Workspace limits are cheap insurance: a capped dev workspace cannot quietly consume the production budget.
Review invoices and payment settings
- Open Settings, then Billing, to find invoices, your current credit balance, and payment methods.
- Download invoices for accounting and match them to your exported cost data if you need line-item detail.
- If you prepay with credits, check the remaining balance here so a depleted balance never interrupts production traffic.
Communicate findings and set a routine
- Save the CSV and invoice PDFs to your finance folder and share the key numbers with stakeholders.
- Run the Cost page monthly (or weekly if spending is high) and export a short report so surprises are rare.
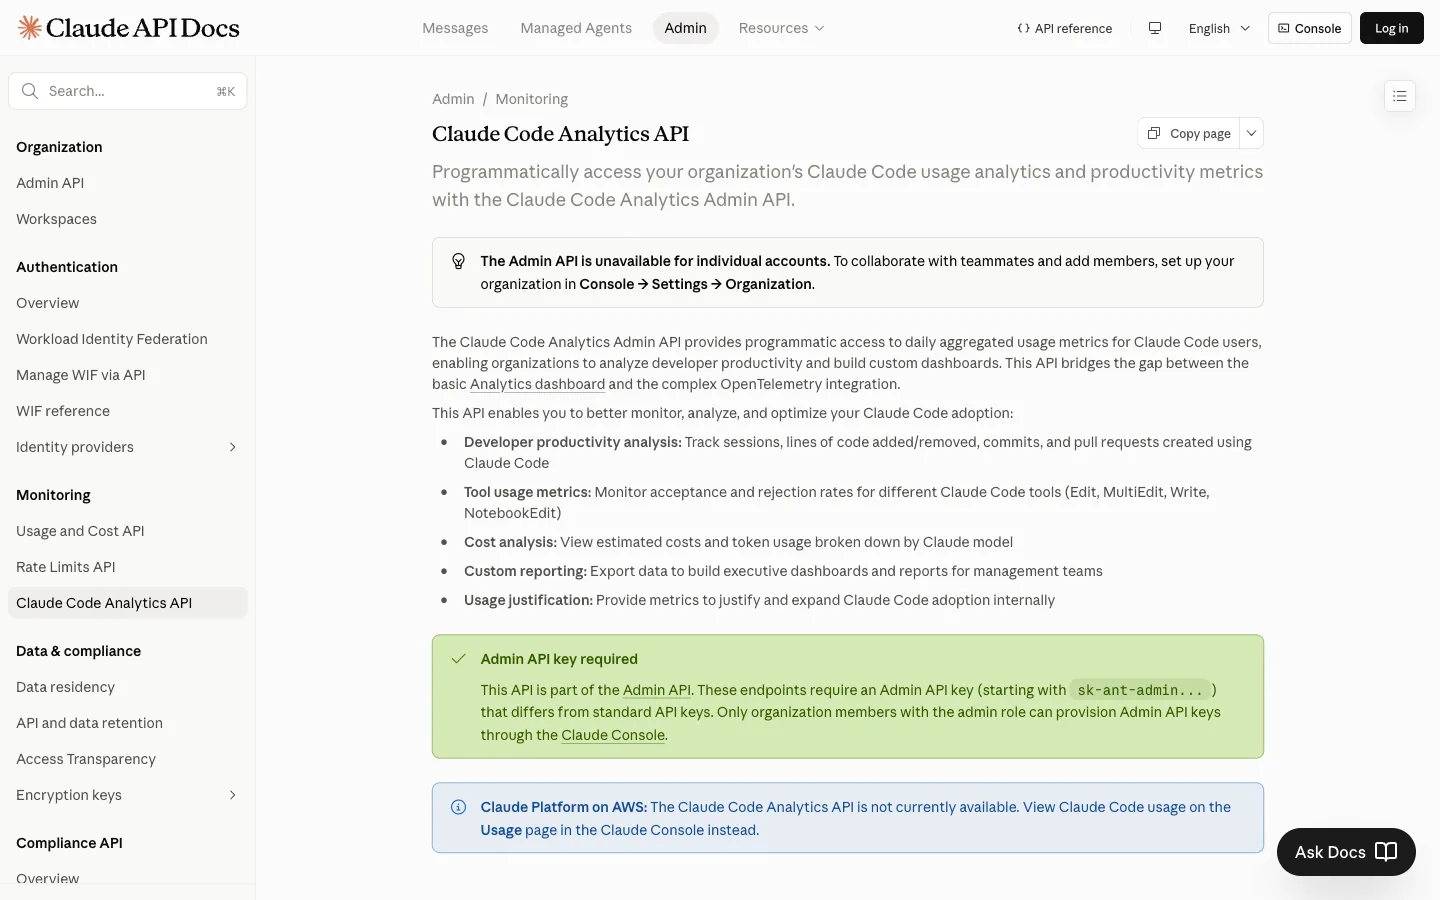
Anthropic’s own Usage and Cost API guide describes the programmatic data as “similar to the information available in the Usage and Cost pages of the Claude Console” (source), so the Console and the API should agree on any date range you check. Use the Claude Console as your starting point before moving on to the API or a third-party tool. For a comparison of tools that go beyond the native Console, see Seven Tools to Manage Anthropic API Spend.
Use Torii for Automated Claude Spend Monitoring
Rather than checking the Claude Console manually each month, you can use Torii, a SaaS Management Platform, to centralize Claude cost monitoring alongside every other SaaS and AI tool. Torii’s Claude spend management feature surfaces your Claude usage and spend next to the rest of your AI portfolio, so finance, IT, and security teams share a single view.
Instead of repeating the manual Console steps each cycle, Torii keeps the data current on its own and can alert the right owner when spend spikes, so nobody has to remember to go look.
To monitor spending in Claude from within Torii, do the following:
1. Sign up for Torii
Contact Torii, and ask for your free two-week proof-of-concept.
2. Connect your Anthropic account to Torii
After your Torii account is active, link your Anthropic organization to Torii using the Claude Developer integration, which connects to your organization, workspaces, and members.
3. Monitor Claude spend in the Torii dashboard
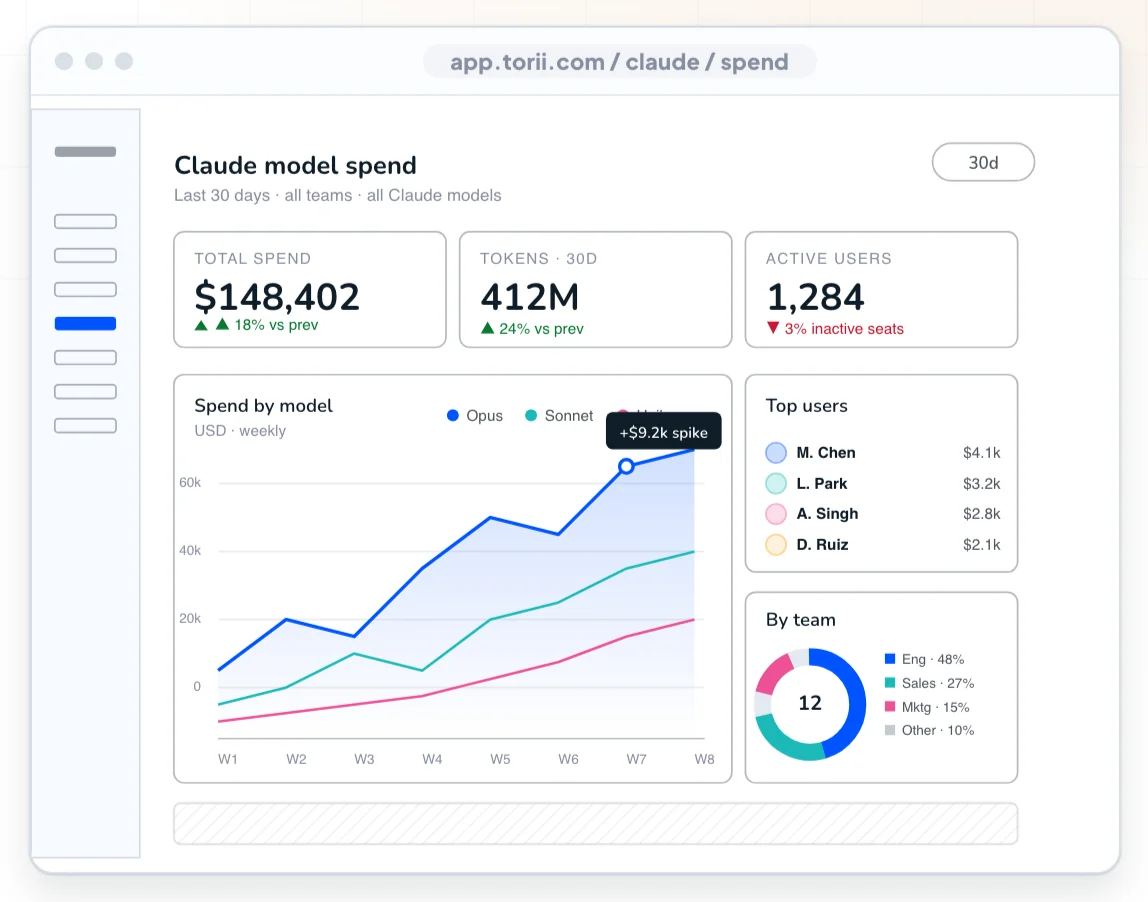
Once connected, open your Claude spend dashboard in Torii. You’ll see total spend, token consumption, and active users at a glance, with breakdowns by model, team, and top users, so you can spot a spike and its owner in the same view.
Query the Anthropic Admin API Usage and Cost Endpoints
Here, you’ll call Anthropic’s Admin API to pull Claude API billing data programmatically. Anthropic’s documentation is blunt about the credential: “These endpoints require an Admin API key, which is different from a standard Claude API key” (source). The key starts with sk-ant-admin, and an organization admin creates it in the Console under Settings. A regular API key will not work.
1. Choose the endpoints to call
GET /v1/organizations/usage_report/messages- returns token usage (uncached input, cache reads, cache writes, output) bucketed over time, with optional grouping by API key, workspace, model, or service tier.GET /v1/organizations/cost_report- returns cost amounts in USD, bucketed by day, with optional grouping by workspace and line-item description.
Use the two together: the usage report tells you which keys, models, and workspaces are consuming tokens, and the cost report converts activity into dollars. The split between those token categories matters, because Anthropic prices a cache read at 0.1x the base input rate and a 5-minute cache write at 1.25x, so two workloads with identical token counts can land a long way apart on the invoice.
2. Make authenticated requests
Set your Admin API key in an environment variable, for example ANTHROPIC_ADMIN_KEY. The Admin API uses the x-api-key header plus an anthropic-version header.
Example curl for the usage report (replace dates as needed):
curl "https://api.anthropic.com/v1/organizations/usage_report/messages?starting_at=2026-08-01T00:00:00Z&ending_at=2026-08-25T00:00:00Z&bucket_width=1d&group_by[]=model" \
-H "x-api-key: $ANTHROPIC_ADMIN_KEY" \
-H "anthropic-version: 2023-06-01"
Example curl for the cost report:
curl "https://api.anthropic.com/v1/organizations/cost_report?starting_at=2026-08-01T00:00:00Z&ending_at=2026-08-25T00:00:00Z&group_by[]=workspace_id" \
-H "x-api-key: $ANTHROPIC_ADMIN_KEY" \
-H "anthropic-version: 2023-06-01"
3. Parse the responses and sum the amounts
- Both endpoints return a
dataarray of time buckets, each with aresultslist. Confirm the field names in the Anthropic docs for your version. - The cost report returns each amount as a decimal string in USD, so parse it as a decimal rather than a float before summing. Example in Python:
import requests, os
from decimal import Decimal

headers = {
    "x-api-key": os.environ["ANTHROPIC_ADMIN_KEY"],
    "anthropic-version": "2023-06-01",
}
params = {
    "starting_at": "2026-08-01T00:00:00Z",
    "ending_at": "2026-08-25T00:00:00Z",
}
r = requests.get("https://api.anthropic.com/v1/organizations/cost_report",
                 headers=headers, params=params)
data = r.json()
total = sum(
    Decimal(item["amount"])
    for bucket in data.get("data", [])
    for item in bucket.get("results", [])
)
print("Total USD:", total)
4. Attribute spend with group_by
- Add
group_by[]=api_key_idorgroup_by[]=workspace_idto the usage report to see which key or team is driving consumption, andgroup_by[]=modelto catch an expensive model doing work a cheaper one could. - Run the same review against Anthropic’s batch pricing. Its pricing page states that “The Batch API allows asynchronous processing of large volumes of requests with a 50% discount on both input and output tokens” (source), so a non-urgent workload still running on the standard endpoint is paying roughly double.
- Note that these endpoints group by key, workspace, and model, not by person. If several developers share one key, the report cannot tell you who spent what, which is a common reason teams move each developer or service to its own key or workspace.
5. Handle pagination and rate limits
- If a response paginates, follow its
has_moreflag and pass the returnednext_pagevalue on the next request until done. - Respect 429 responses: back off, then retry. Use exponential backoff for retries.
6. Automate daily checks and simple alerts
- Run the cost report for yesterday each morning to catch unexpected daily spikes.
- Calculate rolling totals (7-, 30-day) by querying with different date ranges and compare them to your budget thresholds.
- If totals exceed thresholds, trigger an alert from your system. The API calls above are the only Anthropic steps needed to get the data for those checks.
- If your team uses Claude Code, Anthropic also exposes a dedicated Claude Code Analytics API with per-user daily metrics; see Five Claude Code Usage Dashboards and Monitoring Tools for how teams put it to work.
7. Verify results against the Console periodically
Use the same date ranges and compare your API totals to the Console’s Cost page to confirm your parsing is correct. If numbers don’t match, re-check the date boundaries (the API uses UTC timestamps) and whether credits or grouped line items explain the gap.
That’s the flow: call the usage report for token consumption, pull the cost report for dollars, group by key or workspace to attribute spend, handle pagination and rate limits, and run these checks on a schedule to catch surprises. For a deeper look at per-model token tracking, see Six Tools to Track Claude AI Token Usage.
Frequently Asked Questions
You have three ways to track Claude billing and spending: review the Usage and Cost pages in the Claude Console, connect the service to Torii for automated monitoring, or call the Admin API usage report and cost report endpoints programmatically.
The Claude Console at platform.claude.com has a Usage page that charts token consumption and a Cost page that charts dollars, with date filters and breakdowns by workspace, API key, and model, so you can spot daily spikes quickly.
Yes. From the Console's Usage or Cost page you can export a CSV of the data behind the chart, then load it into spreadsheets or BI tools for deeper analysis. Narrow the date range and grouping first if you only need a slice.
Call GET /v1/organizations/usage_report/messages for token usage and GET /v1/organizations/cost_report for daily USD amounts. Both require an Admin API key (sk-ant-admin) and support grouping by workspace, API key, or model for attribution.
By integrating Anthropic with Torii you get a Claude spend dashboard showing totals, tokens, and active users broken down by model and team, sitting alongside every other AI tool, with alerts to stakeholders when spend spikes. This eliminates repetitive manual checks in the Claude Console.
Set organization and workspace spend limits, review invoices monthly, export CSVs, compare API totals to Console figures, run daily cost report queries, and alert when thresholds are breached; these practices catch runaway agents early and prevent unwelcome Claude charges.