SaaS Management vs SAM vs ITAM: What’s the Difference? (2026)
Compare SaaS Management, Software Asset Management, and IT Asset Management scopes, owners, metrics, tools, budget impacts
Ask about this article
Opens Claude in a new tab to answer, using this article as the source.
SaaS now sits alongside traditional software and hardware in every corporate tech stack. Yet many teams still juggle three disconnected governance programs: SaaS Management, Software Asset Management, and broader IT Asset Management, and they rarely agree on where one ends and the next begins. The confusion fuels waste, audit exposure, and territorial battles, so clarifying the borders becomes the first step toward repair.
Scope, ownership, and metrics differ more than most teams realize today. One platform tallies cloud-app seats, another tracks perpetual licenses, and a third monitors laptops from docking station to recycling bin, so their overlapping data and budgets blur accountability and inflate reported savings. A side-by-side comparison shows how each discipline arose and where they now collide.
Mapping scope, ownership, KPIs, data flows, and tooling across all three lets leaders forge a single, cost-savvy asset strategy.
Table of Contents
- Defining Where SaaS, SAM, ITAM Begin
- Who Owns What, and Why It Matters
- Success Measures That Drive Each Practice
- Gathering the Right Data for Oversight
- Choosing Tools That Fit Your Mix
- Conclusion
- Audit your company's SaaS usage today
Defining Where SaaS, SAM, ITAM Begin
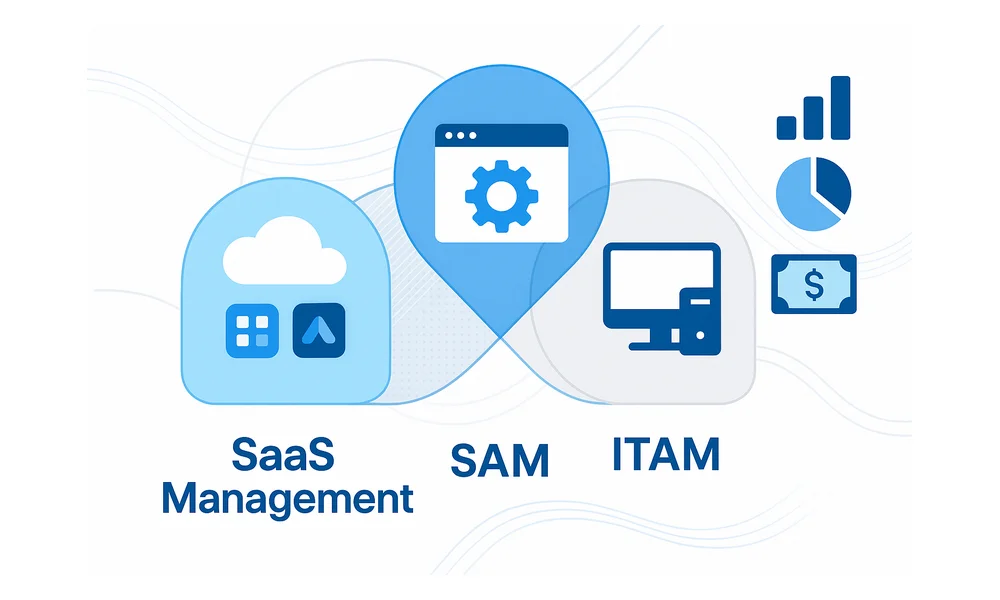
At first glance, SaaS Management, SAM, and ITAM appear to cover the same ground, yet each handles a different part of the tech estate. Ten years ago, most companies bought boxed or downloadable software, logged a serial number, and moved on, but cloud subscriptions turned software spend into an operating expense that renews every month. SaaS Management now tracks anything delivered and billed as a service, from Slack workspaces to SOC-2 monitoring tools. Software Asset Management (SAM) sticks to licensed installs that live on servers or desktops, while IT Asset Management (ITAM) steps back to watch every physical or virtual device that touches the network throughout order, deployment, support, and retirement.
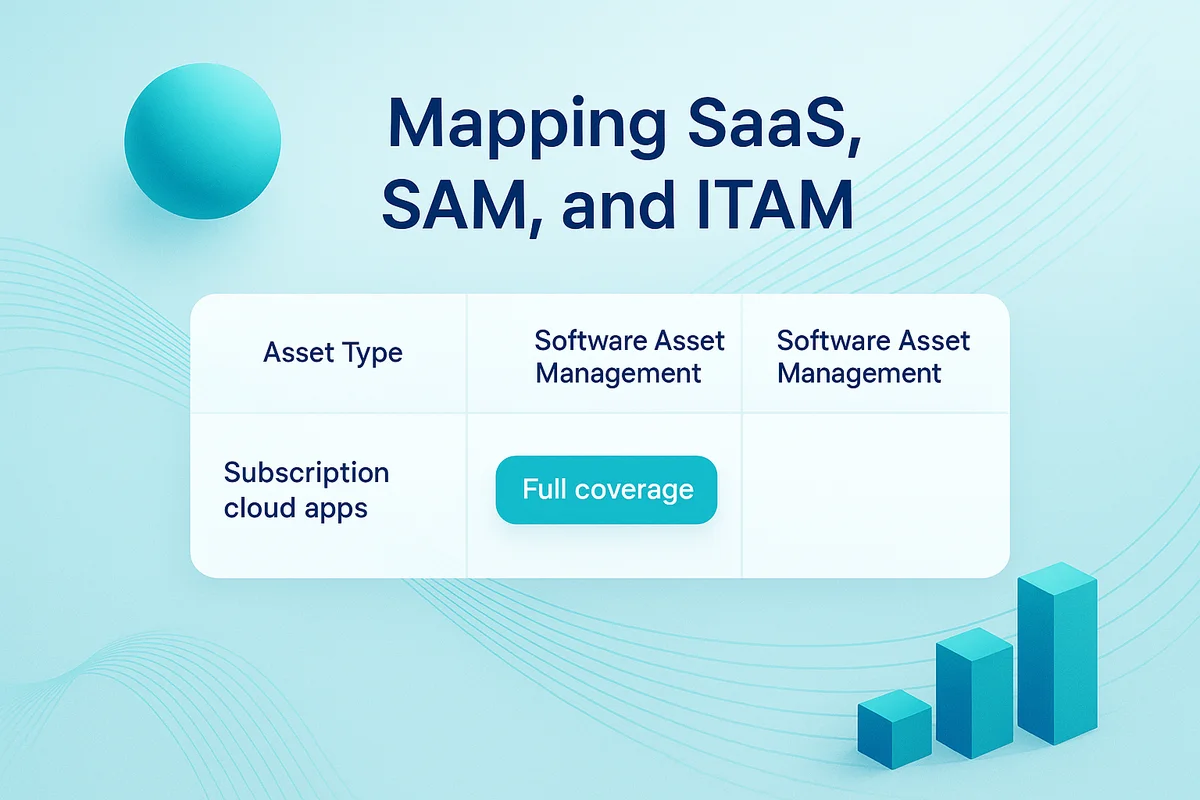
One fast way to spot the boundaries is to map asset categories against each practice.
Asset Type SaaS Management Software Asset Management IT Asset Management
Subscription cloud apps Full coverage Minimal, only if bundled Reference only
Installed software Usage reference Full coverage Reference only
Physical hardware Out of scope Out of scope Full coverage
Public cloud IaaS/PaaS Shadow-IT check License impact Growing coverage
Not every team needs all three disciplines in equal measure, yet skipping one leaves blind spots. Consider the following overlapping but distinct domains:
- Cloud suites such as Microsoft 365 that include both SaaS and installed components.
- Virtual machine images carrying perpetual Oracle licenses into AWS.
Each asset type still moves through request, approval, acquisition, deployment, support, and retirement, even if the tempo varies. SaaS can be activated in minutes, pushing governance to the front of the cycle, while hardware assets remain capitalized for three to five years before sunset. IDC estimates that SaaS made up 70 percent of software spend in 2023, up from 38 percent in 2018, a swing that explains why legacy SAM taxonomies struggle to keep pace. Even so, SAM’s legal focus on entitlement and ITAM’s emphasis on depreciation still matter, and a clear scope baseline keeps teams from fighting the wrong battle.
Who Owns What, and Why It Matters
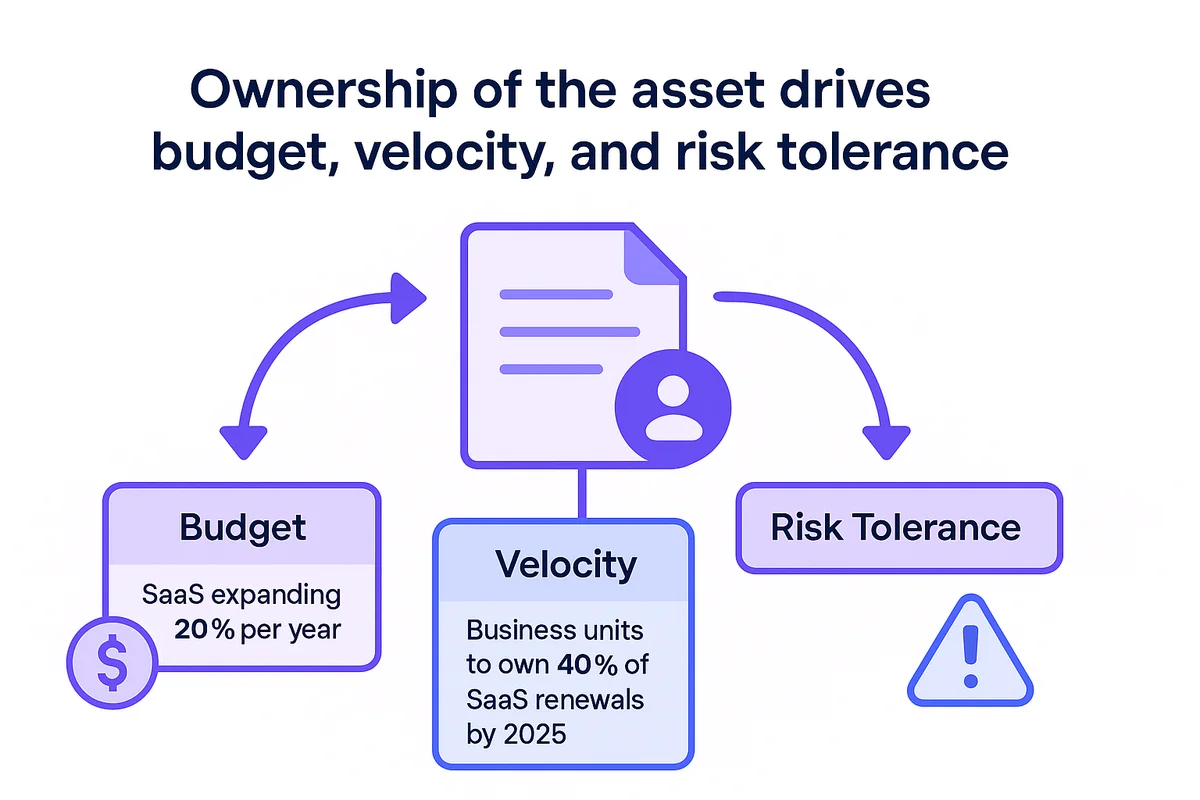
Ownership of the asset debate drives budget, velocity, and risk tolerance for all three disciplines. With SaaS expanding more than 20 percent a year, companies keep redrawing their org charts to stay afloat.
SaaS Management almost never sits inside core IT; it usually lands wherever the invoices show up. Many midsize firms stash the role under a FinOps lead who already tracks AWS and Azure spend, while others route it to a SaaSOps team on the service desk. Marketing and sales often control the renewal wallet because they bought the tool in the first place, and Gartner expects business units to own 40 percent of SaaS renewals by 2025. That setup moves fast, yet decentralization lets a Slack workspace hang around months after the project ended.
SAM still belongs to the licensing, vendor-management, or enterprise-architecture crew that has sparred with Oracle and IBM auditors for years. They focus on version tallies, entitlement files, and decade-old clauses, so centralized decisions suit them. Audit defense dictates their calendar; the CFO only steps in when a shortfall appears.
ITAM casts a wider net, tracking anything that ships with a serial number or shows up on a depreciation schedule. Asset offices, often tucked inside service management, create golden records, oversee hand-offs, and close the loop when hardware retires. Because the practice owns barcodes and balance sheets, it straddles IT and finance, answering to whoever bankrolls the next refresh.
Blind spots open when the three groups overlap but stay silent. A short RACI grid keeps surprises off the audit table:
- Contract negotiation: LoB for SaaS, SAM for perpetual, ITAM for hardware bundles
- Renewal timing: FinOps calendar for SaaS, vendor-driven cycles for SAM, depreciation milestones for ITAM
- Security posture: SaaSOps sets SSO policies, SAM checks patch levels, ITAM confirms disposal papers
- Audit response: Central SAM lead coordinates and pulls data from SaaS and ITAM tools as needed
Budget lines reveal a different picture than ownership charts ever show. SaaS charges hit OPEX immediately, so LoB leaders feel every unused seat each month, while SAM and ITAM plan capital outlays years in advance. Without one playbook, leaks slip through whichever column no one watches.
Success Measures That Drive Each Practice
Saving money alone rarely satisfies stakeholders; each asset team needs proof the cash stayed put for the right reason.
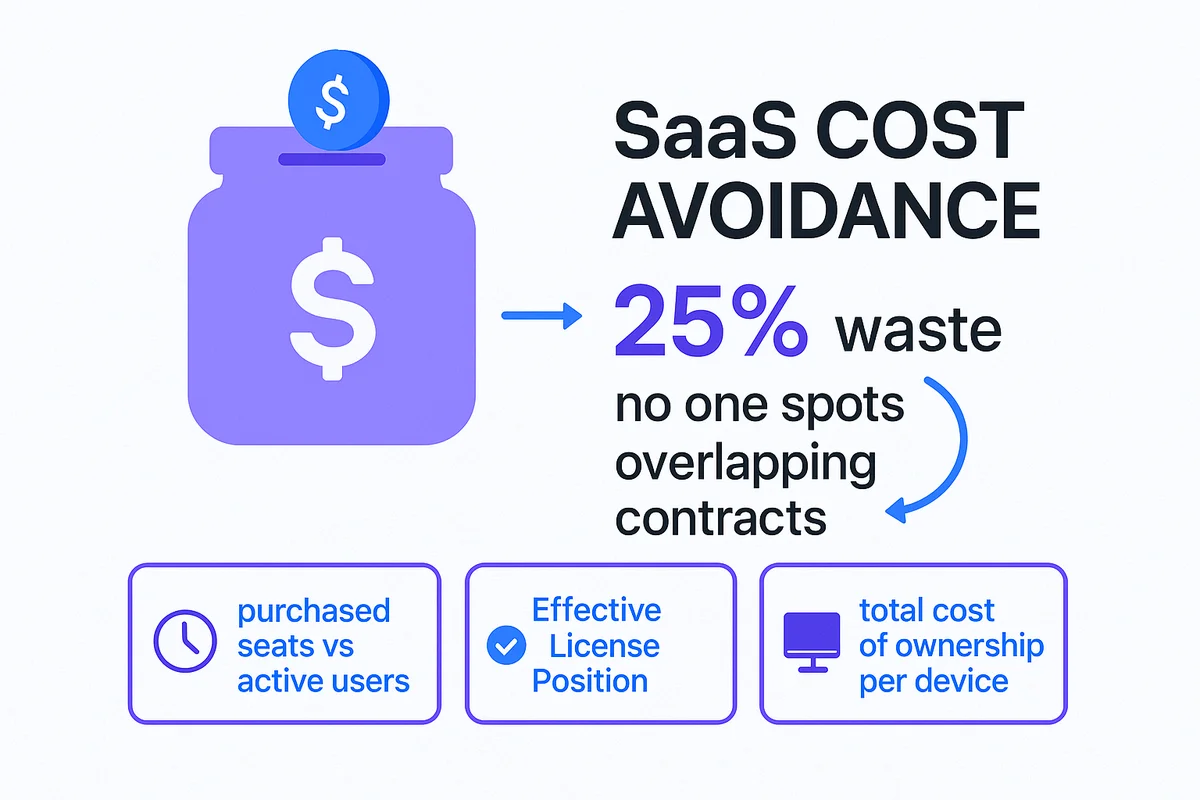
SaaS managers live inside monthly statements and attack costs fast, turning off idle seats before renewal cycles bite. Gartner still sees about 25 percent waste, a figure that jumps when no one spots overlapping contracts in time.
- SaaS KPIs: purchased seats vs active users, renewal avoidance rate, number of unsanctioned apps discovered
- SAM KPIs: Effective License Position accuracy, audit penalties averted, percent of contracts on optimal tier
- ITAM KPIs: total cost of ownership per device, refresh cycle compliance, maintenance spend against book value
Software Asset Management succeeds or fails during audits that can claw back several years of fees. Teams therefore watch entitlement gaps, downgrade rights, and processor counts instead of monthly usage trends. A tight Effective License Position feels dull, yet it keeps surprise liabilities off the balance sheet.
IT Asset Management programs operate on a longer clock than SaaS reviews. Depreciation schedules, warranty cliffs, and disposal rules decide whether that four-year-old laptop stays in service or heads for recycling. A tuned ITAM program can reclaim 10 to 15 percent of capital outlay by timing refreshes to rebates and optimized lease returns. Speed matters less; accuracy across three to five years matters more, which is why ITAM values lifecycle metrics above daily usage charts.
Overlap is real, but success metrics rarely travel well. You might cut 200 Slack seats and still fail an IBM PVU audit or overpay for storage arrays. Map every number to the cash bucket it protects, OPEX for SaaS, compliance risk for SAM, and CAPEX efficiency for ITAM, then check where one program’s win could undermine another forecast.
Gathering the Right Data for Oversight
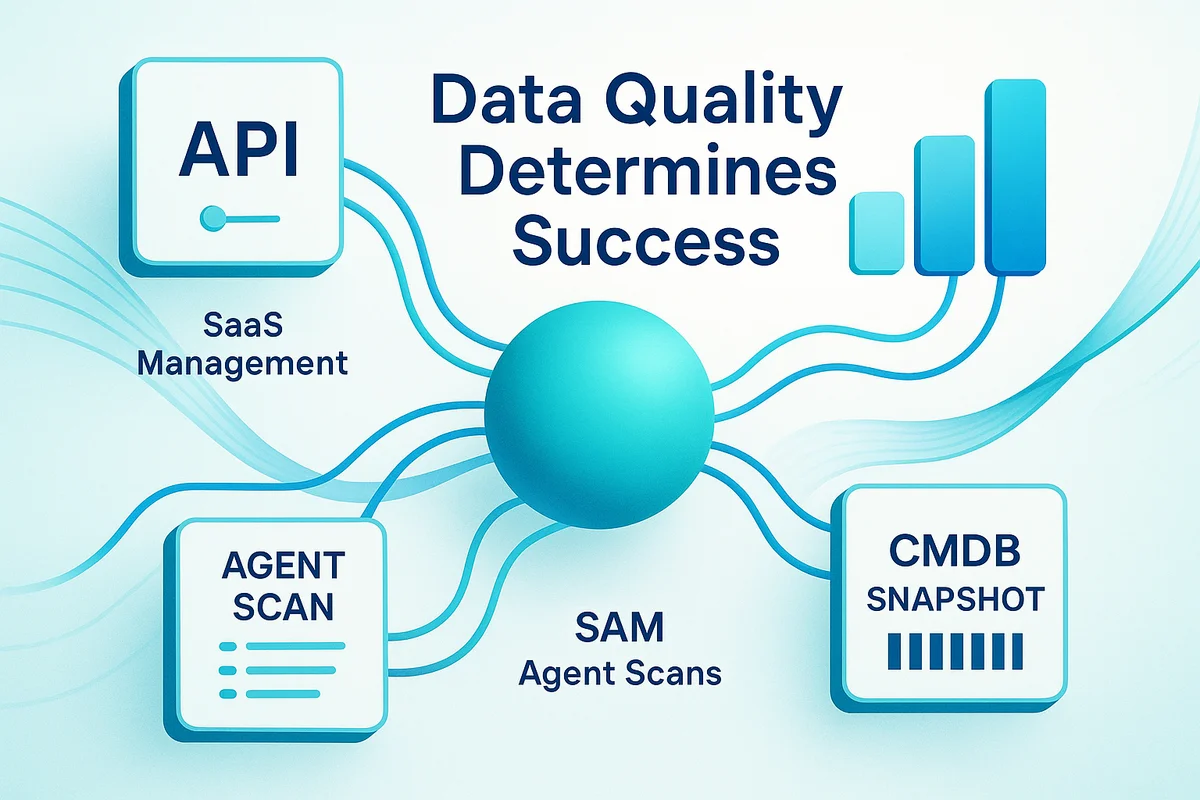
Data quality determines success for all three disciplines, but their input streams still look nothing alike. SaaS Management pulls API calls from vendors such as Okta or Google Workspace and marries them with finance exports that list every credit-card charge. SAM still relies on weekly agent scans that list installed executables, then matches those findings against dense contract tables. ITAM gets its view from CMDB snapshots, barcode scans, and depreciation figures pulled from ERP. When separate owners merge these feeds, mismatched identifiers often hide gaps until an audit or renewal forces the issue.
Timing introduces a separate set of headaches for each data source. A revoked Salesforce seat that lingers for 48 hours can burn thousands, so SaaS sensors ping every few minutes. Static install counts rarely change overnight, letting SAM stick with daily or weekly sweeps. Hardware drifts even slower; laptops refresh every three to five years, so ITAM can get by on milestone updates tied to procurement, deployment, and disposal. The faster the spend, the tighter the polling.
Below are the fields most teams refuse to compromise on. Keep them consistent across sources before tackling anything ambitious.
- SaaS Management: tenant ID, user email, role, last login, renewal date, monthly spend
- SAM: device name, software title, version, installed count, entitlement quantity, contract SKU
- ITAM: asset tag, model, serial number, location, custodian, purchase value, retirement date
Normalization remains the stage in which far too many data projects bog down. A SaaS tool may label the product “Adobe Creative Cloud” while finance records “ADBE-SUB-CC” and the end user simply calls it Photoshop. SAM wrestles with SKU variants that differ by region or bundle, and ITAM fights reimaged laptops that inherit fresh hostnames. The quickest path out of lookup chaos is a reference catalog that maps every alias to one canonical record; many firms seed that catalog with public datasets and refine it during each audit cycle.
Privacy considerations introduce yet another significant hurdle that teams cannot ignore. SaaS click-stream logs expose user behavior down to the file touched, triggering consent and retention rules that never apply to an idle server. Mask sensitive fields at collection rather than during reporting, or risk reworking every downstream dashboard when policies tighten.
Choosing Tools That Fit Your Mix
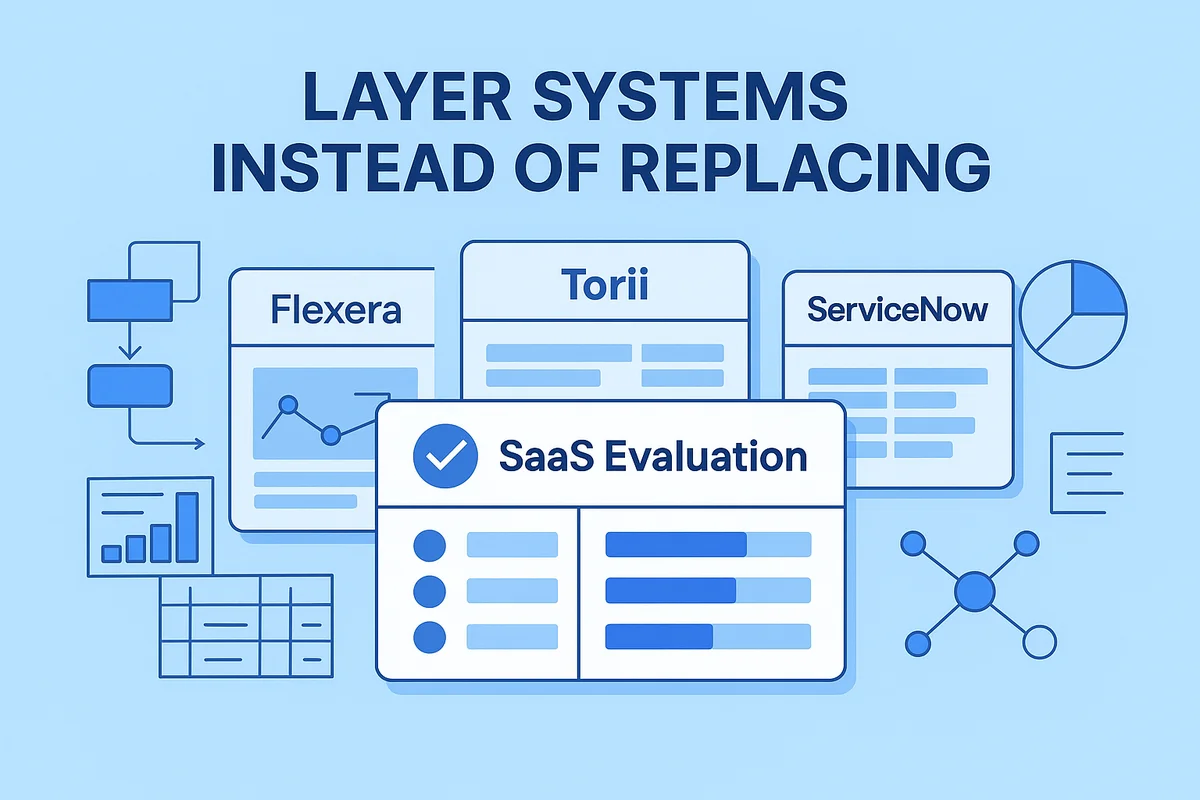
Few asset teams get to start fresh when evaluating new platforms. Traditional SAM suites such as Flexera still handle SKU catalogs and audit workflows well, yet they rarely connect directly to HRIS or Okta logs where SaaS usage shows up. SaaS-first tools like Torii excel at API coverage and seat analytics, but can’t see laptop depreciation or RFID tags without extra help. ITAM staples like ServiceNow unite hardware, incident, and lifecycle tasks, although their SaaS license modules often rely on custom tables. Because no single stack covers everything, most leaders layer or phase systems instead of ripping and replacing.
When mapping workflows, first look at the systems that already trigger action. If renewals route through Coupa, the SaaS tool must push purchase requests back there automatically, not by emailed CSV. If security reviews live in Jira, the SAM engine needs a two-way issue feed to prevent duplicate tickets. Charts matter less than whether the data feeds existing approvals, because once budgets tighten people follow tasks, not dashboards. One missed handoff can cancel out the savings from ten spotless reports.
A quick decision matrix keeps debates anchored in real numbers instead of slideware. Rate each vendor 1–5 against business-critical criteria, then sort by weighted score:
- API depth and maintenance cadence
- License analytics that model OPEX, CAPEX, and chargebacks in one view
- Automation hooks for joiner-mover-leaver and asset staging events
- Native integration with service desk, procurement, and finance systems
- Scalability to handle at least 3x current asset counts without re-architecting
Plan only twelve months ahead; five-year forecasts rarely survive the first reorg. A single acquisition can double the SaaS estate, and a flood of IoT sensors may jam the CMDB overnight. Tools built on open schemas and published webhooks flex faster than monolithic databases locked behind quarterly releases. Before signing, demand a sandbox that mirrors production volumes; scripts that sync 10,000 rows today need to move 100,000 tomorrow without throttling. Document which team owns every integration, because an unfunded connector often erases year-two savings.
Conclusion
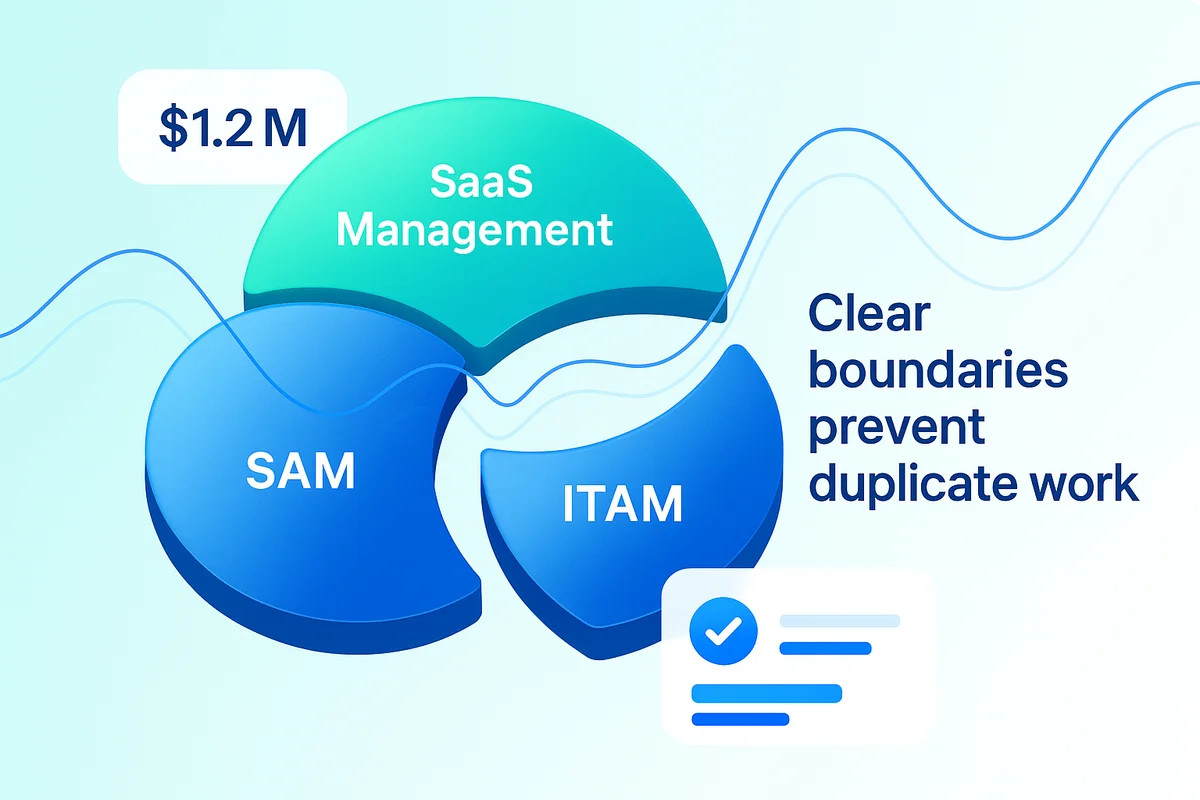
SaaS, SAM, and ITAM each handle a different, though sometimes overlapping, slice of technology spending. When we map scope, ownership, metrics, data needs, and tooling, it becomes clear that every discipline answers its own financial and operational questions while working under the same savings pressure. Clear boundaries prevent duplicate work, close audit gaps, and ensure each dollar is routed to the right owner.
Keep SaaS Management, SAM, and ITAM working side by side, give them shared data and goals, and the business finally gains the full asset picture without paying twice.
Audit your company’s SaaS usage today
If you’re interested in learning more about SaaS Management, let us know. Torii’s SaaS Management Platform can help you:
- Find hidden apps: Use AI to scan your entire company for unauthorized apps. Happens in real-time and is constantly running in the background.
- Cut costs: Save money by removing unused licenses and duplicate tools.
- Implement IT automation: Automate your IT tasks to save time and reduce errors - like offboarding and onboarding automation.
- Get contract renewal alerts: Ensure you don’t miss important contract renewals.
Torii is the industry’s first all-in-one SaaS Management Platform, providing a single source of truth across Finance, IT, and Security.
Learn more by visiting Torii.
Frequently Asked Questions
SaaS Management tracks cloud services; Software Asset Management (SAM) manages licensed software installations, and IT Asset Management (ITAM) oversees all physical and virtual devices connected to the network.
Ownership determines budget control, decision speed, and risk management across SaaS, SAM, and ITAM, ensuring accountability in asset management amidst decentralized environments.
Each discipline overlaps in managing assets such as cloud suites and virtual machines, leading to potential gaps when teams don't communicate about shared resources or contracts.
SaaS KPIs focus on usage and cost management, SAM emphasizes compliance and entitlement accuracy, while ITAM tracks total ownership cost and lifecycle metrics for devices.
SaaS requires user activity data, SAM needs software title and version info, and ITAM focuses on asset details like serial numbers and purchase values to ensure accurate oversight.
Selecting the right tools involves assessing API capabilities, license analytics, automation features, and ensuring integrations with existing systems to enhance overall asset management.
Data normalization ensures consistent identifiers across SaaS, SAM, and ITAM systems, preventing discrepancies that could lead to audit issues or inaccurate financial reporting.