Best Practices for Categorizing and Organizing Your SaaS Apps in 2026
Learn step-by-step SaaS taxonomy, department mapping, function tagging, risk scoring and cost center links to cut spend.
Ask about this article
Opens Claude in a new tab to answer, using this article as the source.
Growing companies often run into SaaS sprawl long before they recognize the warning signs. A few early subscriptions quickly multiply into a stack of overlapping tools that drain budgets, muddy accountability, and slow security reviews. Without a shared, trusted catalog, every procurement call turns into detective work and renewals slide through with barely a glance.
Finance races to match invoices with owners, IT sifts through unapproved connections, and department leads debate which tool stays on the books. Everyone feels the mess, yet few know where to start. The solution isn’t another dashboard; it’s a clear tagging system that shows who uses what and why.
This guide walks you through building a master taxonomy, layering department, function, risk, and cost-center tags to expose waste and cut spend.
Table of Contents
- Crafting Your Unified SaaS Taxonomy
- Mapping Apps to Accountable Departments
- Tagging by Function to Spot Overlap
- Grouping Apps by Risk and Compliance
- Aligning SaaS Spend with Cost Centers
- Conclusion
- Audit your company's SaaS usage today
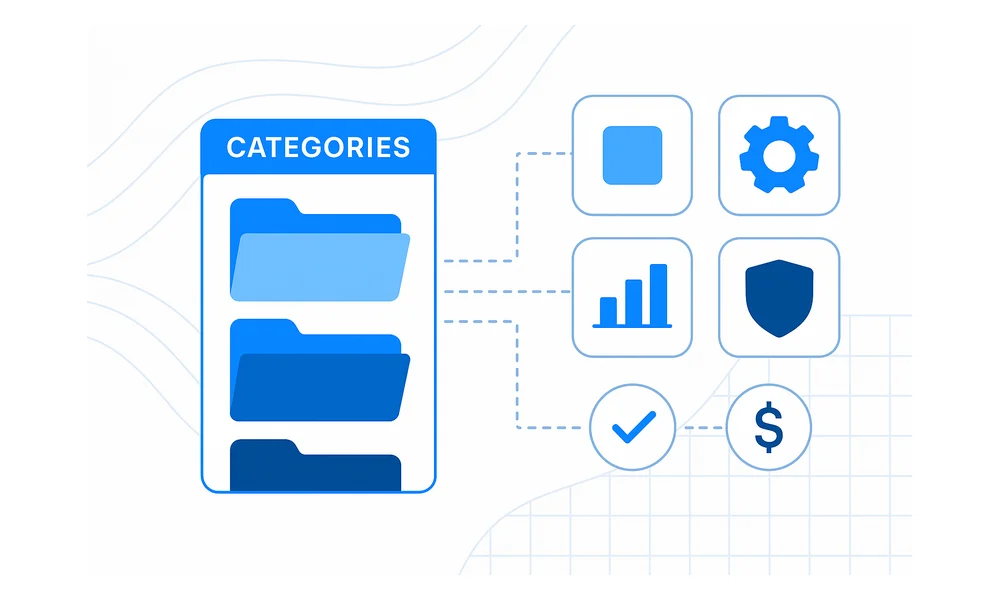
Crafting Your Unified SaaS Taxonomy
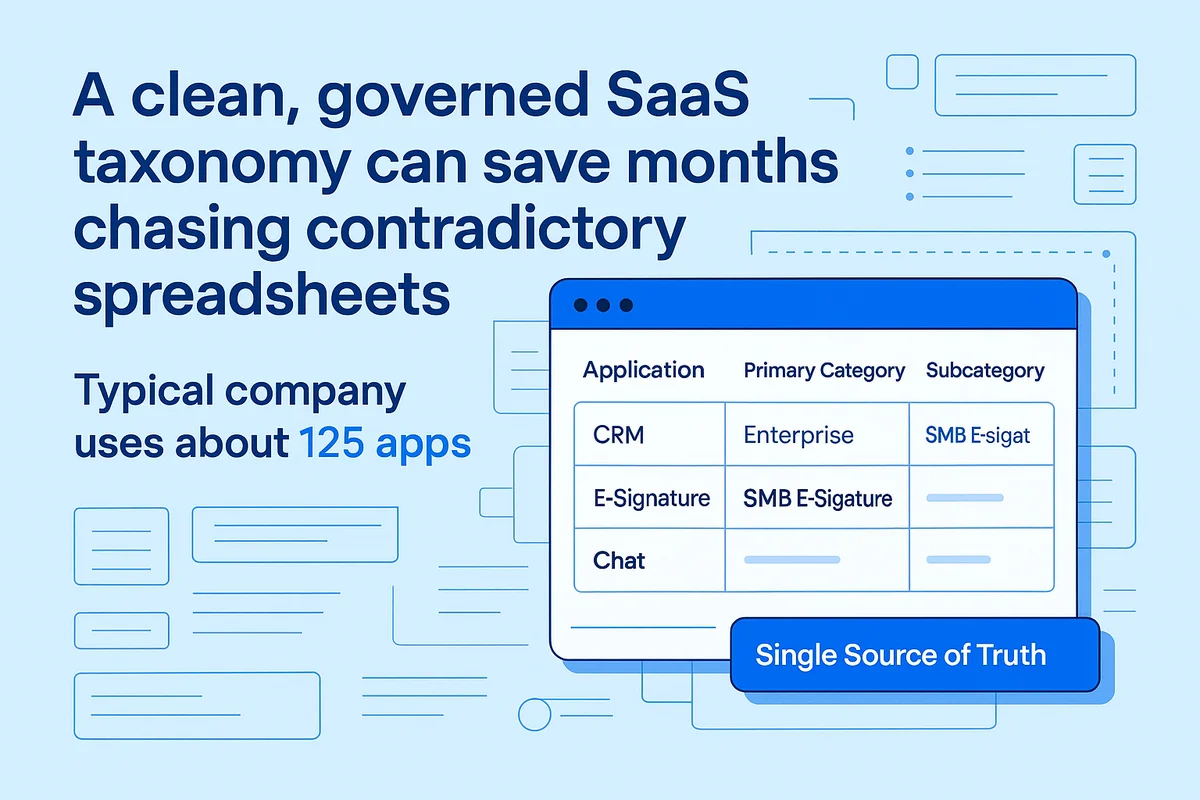
A clean, governed SaaS taxonomy can save months chasing contradictory spreadsheets. Gartner says the typical company now uses about 125 apps, yet finance, IT, and security still maintain separate inventories that rarely agree on license counts or even app names. Anchoring everything in a single source of truth, for example a SaaS management or IT asset platform such as Service lets every downstream tag pull from the same record so duplicates die before they spread.
Start by choosing a two-tier naming convention everyone can understand. The primary category states what the tool is (CRM, E-signature, Chat) while the subcategory explains how it’s used, say Enterprise CRM or SMB CRM. Each tier gets an owner, often the SaaS admin for the category and the most active business user for the subcategory; their job is to approve edits, not stamp every suggestion. This guardrail stops renaming from spiraling when marketing suddenly labels Slack “asynchronous collaboration” and someone else records the spend as “team messaging.”
Once names stay steady, attach metadata fields that future filters can grab. The platform should capture at least:
- Renewal date (month and day, not just quarter)
- Current and maximum license count
- Contract owner and email
- GDPR or regional data residency scope
- Internal support tier (self-service, help desk, dedicated admin)
Storing these attributes right beside the name means risk, department, and cost center labels can reference them without VLOOKUP gymnastics. One long renewal column beats ten scattered calendars.
No one wants to hand-type 125 entries, so pull lists from the systems you already trust. Finance can export vendor records with GL codes, and your identity provider logs reveal every app touched in the last 30 days. Most SaaS platforms will accept a CSV import; map the vendor name to the primary category column, leave unknown fields blank, and let the owners refine later rather than block the upload.
Mapping Apps to Accountable Departments
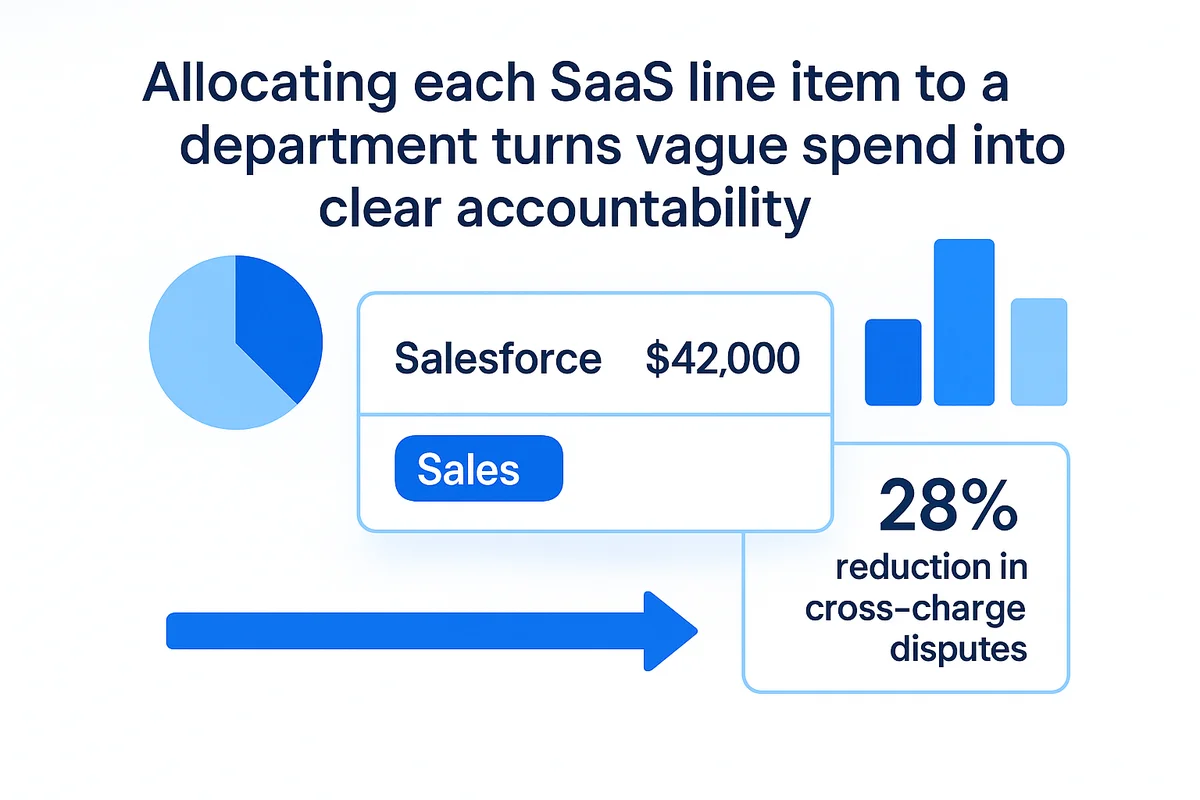
Allocating each SaaS line item to a department turns vague spend into clear accountability. When Finance sees “Salesforce ($42,000)” tied to Sales rather than IT, the budget conversation flips from blame to ownership. In a 2023 ProcureTech survey, firms using department tags reduced cross-charge disputes by 28 percent during the first year because access, support, and cost questions all landed with the same manager instead of bouncing around Slack.
Begin mapping with one clear rule: the team hurt most by downtime keeps the tag, unless another cost center foots the bill. Then formalize that logic so procurement and IT ticketing stay aligned.
- If downtime stops revenue, the revenue team owns the tag even when Finance pays.
- If the biller and primary user match, the decision is easy; tag both categories to the same department.
- If the app supports enterprise-wide compliance or payroll, default to Finance or HR to speed audits.
- Break ties by asking who approves new user seats; their sign-off equals ownership.
In day-to-day operations, department boundaries blur more than most teams admit. Marketing directs HubSpot campaigns every day, yet Finance still handles the invoice to keep vendor counts low. DocuSign templates originate in Legal, but Finance keeps the subscription because signature volume affects revenue recognition. By baking those quirks into the tagging rubric, renewals stop stalling while teams argue about who should negotiate.
Quarterly internal audits become far quicker once tags are in place. Rather than comb through a 500-row spreadsheet, each director filters the dashboard to their apps, checks license counts, and signs off. When a merger hits, the benefit multiplies. Drop the legacy company’s cost-center codes into the platform, bulk reassign fifty apps from “Corp IT” to “North America Sales,” and the exposure report updates instantly. Security sees which orphaned tools lack owners, HR spots duplicate onboarding workflows, and Finance can cut redundant contracts before the integration team even meets. Clean department tags create that speed, and speed always saves money.
Tagging by Function to Spot Overlap
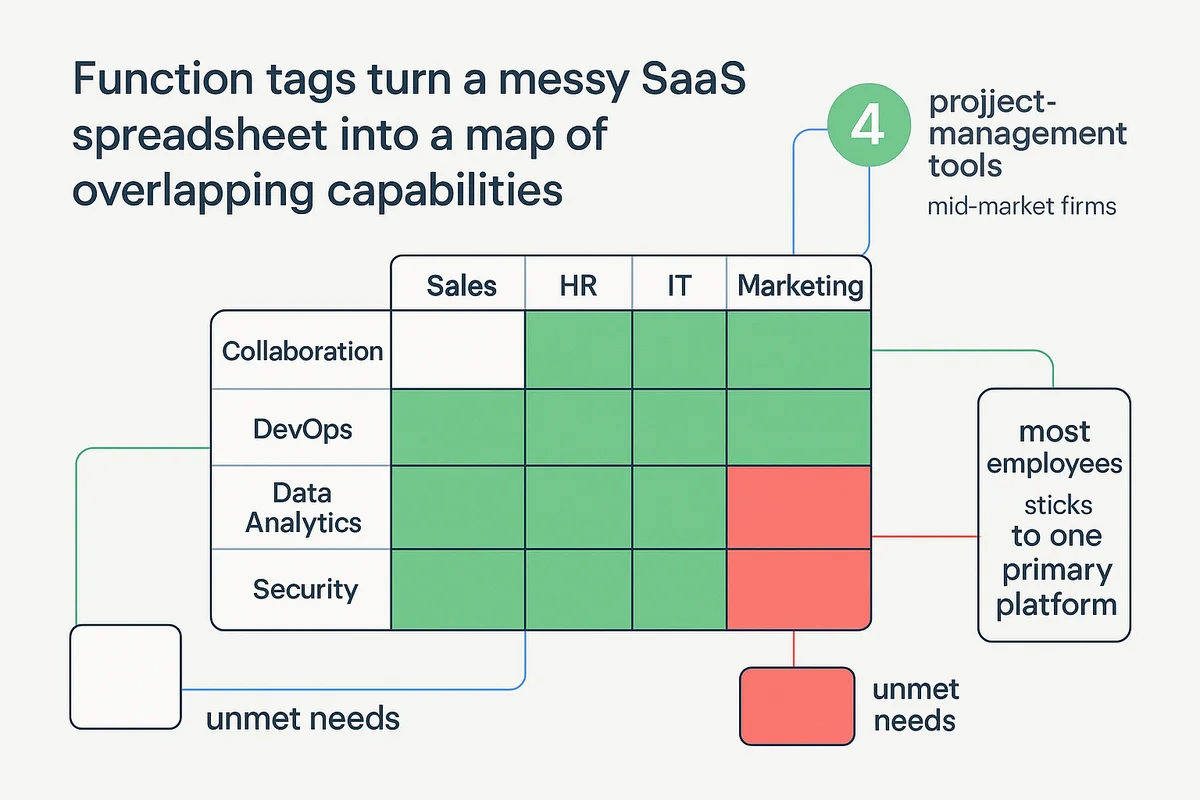
Function tags turn a messy SaaS spreadsheet into a map of overlapping capabilities. Suddenly you can see where features overlap and where genuine gaps remain across teams and departments.
When every app lands in a clear functional bucket such as Collaboration, DevOps, Data Analytics, or Security, the portfolio stops feeling endless and random. Gartner found that mid-market firms run an average of four project-management tools, yet most employees stick to one primary platform. By stamping each option with the same “Project Tracking” tag, IT spots the duplicate spend before renewal quotes appear and walks into vendor calls holding hard data rather than hunches.
Heat mapping turns those tags into a quick visual scorecard for every department. Feed department and function tags into a pivot table, then color the squares by license count or annual cost. A red block under “Sales” and “Video Conferencing” flags obvious overlap to procurement, while an empty square highlights unmet needs that drive shadow IT. Snowflake and similar data platforms expose tag data through an API, letting you refresh the grid each week without exporting CSVs.
Multi-function platforms complicate tagging, yet a few rules keep the taxonomy predictable:
- Assign the primary tag based on the feature driving purchase justification.
- Add up to two secondary tags for discoverability, separated by a semicolon in the metadata field.
- If the tool covers more than three critical functions, create a “Platform” flag so analysts know to evaluate bundles, not modules.
- Use automated keyword scans of vendor descriptions to suggest secondary tags, then require human approval before they go live.
Basic automation can handle the grunt work once tagging rules are in place. A simple script pulls each new app’s marketing blurb, searches for terms like “kanban,” “SSO,” or “data lake,” and proposes matching categories. Over time the algorithm learns company-specific language (one firm’s “huddle” equals another’s “stand-up”), which reduces manual reviews by as much as 60 percent. Teams can now focus on actual rationalization instead of data hygiene.
Tagging by function looks trivial until you see the renewal calendar shrink. Tools that share a bucket compete for the same budget line, so vendors discount faster and users migrate sooner, trimming redundant licenses while improving adoption of the chosen platform.
Grouping Apps by Risk and Compliance
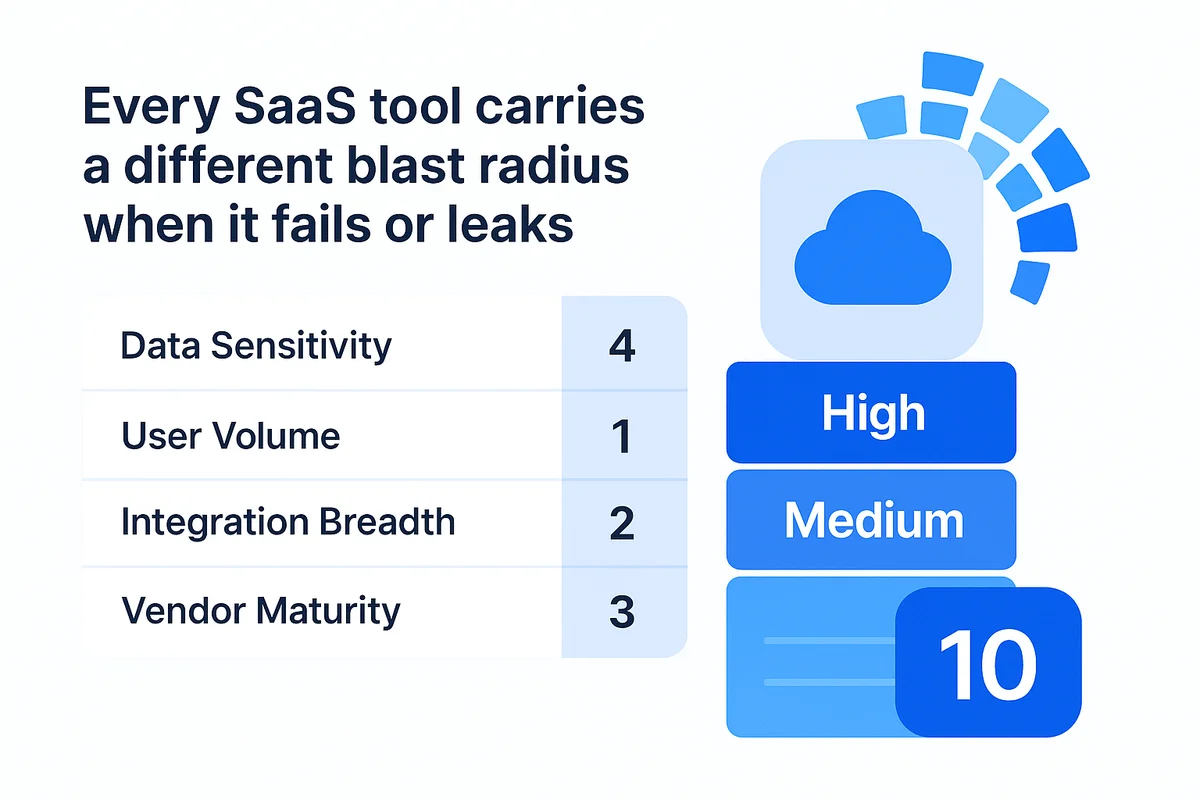
Every SaaS tool carries a different blast radius when it fails or leaks. A basic three-tier risk matrix (Low, Medium, High) makes it easier to decide which apps need extra scrutiny and which can follow the usual checklist. Score each application on four data points pulled from system logs and vendor profiles, add up the numbers, and park the result in a tier.
Use a five-point scale for each input so math stays quick in spreadsheets or APIs.
- Data sensitivity: public marketing assets merit one point; customer PII earns five.
- User volume: fewer than twenty seats equals one, anything over five hundred scores five.
- Integration breadth: a standalone niche tool is low; platforms tied into SSO, CRM, and billing hit five.
- Vendor maturity: companies with a public trust center and SOC 2 Type II receive one, early-stage startups with no attestations receive five.
After scoring each dimension, add the four numbers together to determine tier: totals from 4–8 fall into Low, 9–12 into Medium, and 13–20 into High.
Numbers alone don’t help until they trigger workflows the instant risk thresholds change. Send the score to your ticketing system so High-risk apps automatically need a security review, legal’s DPA, and a fresh penetration test before procurement hits Approve. The same flag can schedule quarterly evidence collection in Jira so audit artifacts live where auditors already look.
Keeping scores current is easier when outside scanners push findings straight into the taxonomy. When Netskope spots shadow file sharing or BetterCloud detects new admin grants, the integration bumps the integration-breadth value in real time and recalculates the tier. Color badges on the renewal calendar then spotlight High-risk contracts coming due within 90 days, giving security and procurement a running start on remediation or negotiation.
Aligning SaaS Spend with Cost Centers
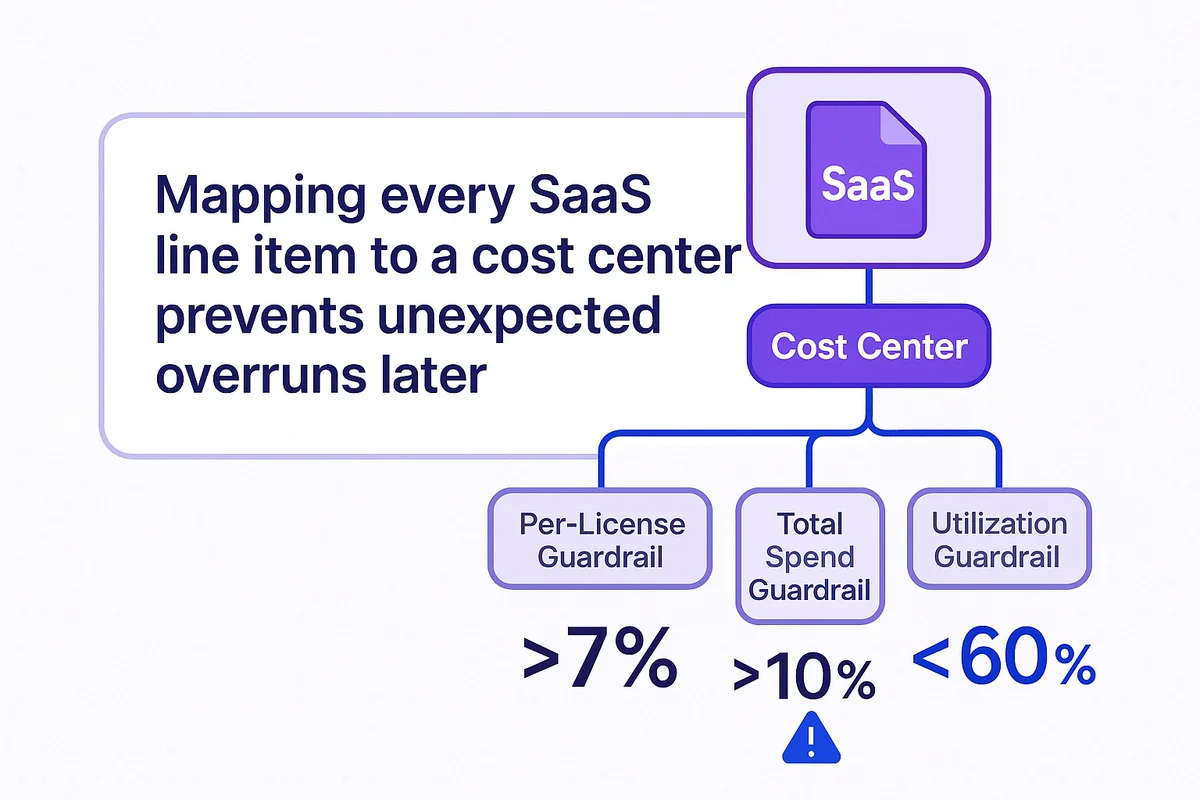
Mapping every SaaS line item to a cost center prevents unexpected overruns later. Finance can book Jira licenses to Engineering-Cloud (6105) while the same app’s professional services hit Consulting-External (7810), keeping accruals tidy. When renewal dates sit next to those codes, forecast models in NetSuite update automatically instead of anyone chasing spreadsheets each quarter.
Numbers speak loudest when something’s off, so set hard ceilings that trigger alerts before money slips away.
- Per-license guardrail. Flag contract renewals where the unit price jumps more than 7 percent year over year.
- Total spend guardrail. Notify the owner when monthly outlay beats the forecast by 10 percent.
- Utilization guardrail. Surface applications with seat usage below 60 percent and ask if licenses can drop.
Cost center tagging alone shows only one slice of the pile. Roll spend up a level by combining department, function, and risk metadata already in the system. A board question such as “What are we spending on high-risk customer data tools?” turns into a two-click answer: $1.4 million across three vendors, with 42 percent of that up for renewal this half. Security joins the conversation early, and Procurement arrives with overlap data that often cuts quotes by 15 percent.
End-of-year true-ups finally become a process instead of a scramble. Export the categorized portfolio, match paid seats against actual logins pulled from your SSO, and feed variances back to cost center owners. Apps showing less than 50 percent use move onto a trade-down worksheet; those above 90 percent hit a forecast-increase column. Finance circles back with a single slide summarizing headcount growth, license adjustments, and the resulting delta by GL code. Teams leave the meeting with action items, not surprises, and the next budget cycle starts with numbers everyone trusts.
Conclusion
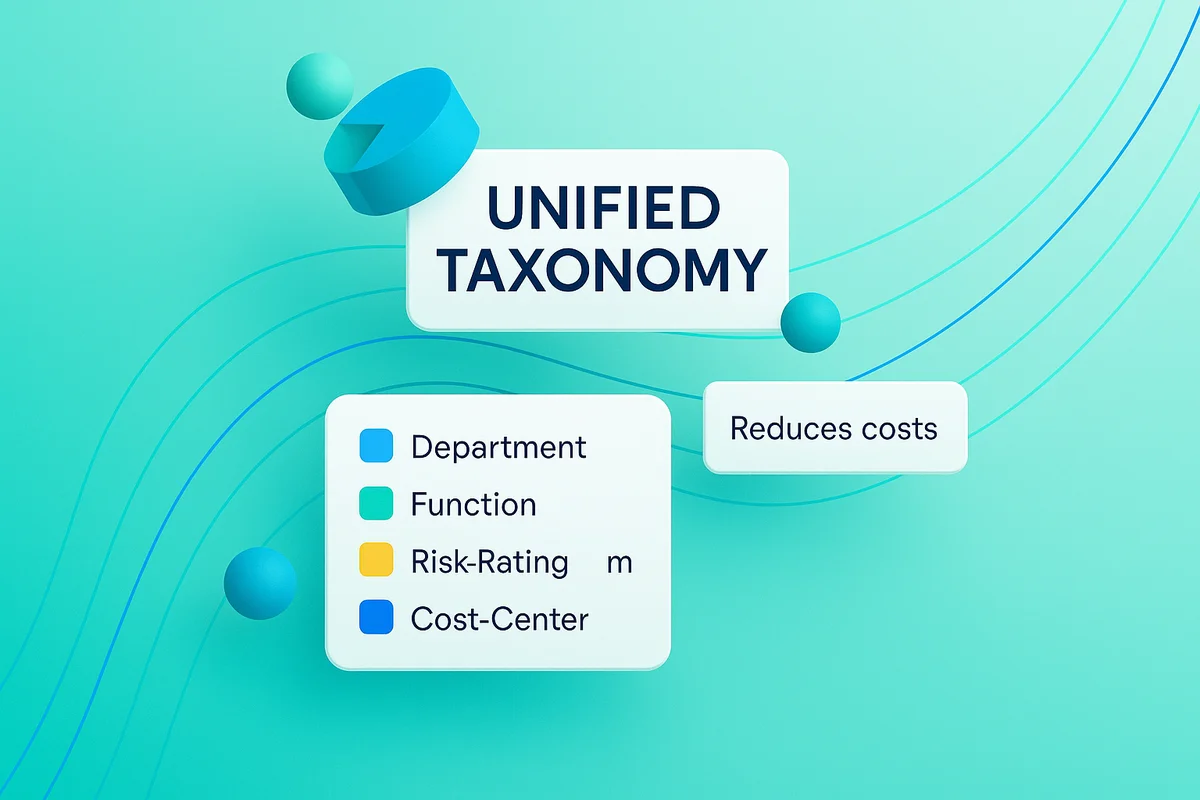
Controlling SaaS sprawl starts with agreeing on one definitive label set. Upload the base taxonomy, finish naming conventions, and connect renewal and usage data. Add department owners, functional tags, risk ratings, and cost-center codes so every app surfaces in one searchable list ready for cleanup.
This groundwork reduces costs, accelerates audits, and gives procurement a head start on upcoming renewals. A unified taxonomy turns stray apps into spend you can measure and steer.
Audit your company’s SaaS usage today
If you’re interested in learning more about SaaS Management, let us know. Torii’s SaaS Management Platform can help you:
- Find hidden apps: Use AI to scan your entire company for unauthorized apps. Happens in real-time and is constantly running in the background.
- Cut costs: Save money by removing unused licenses and duplicate tools.
- Implement IT automation: Automate your IT tasks to save time and reduce errors - like offboarding and onboarding automation.
- Get contract renewal alerts: Ensure you don’t miss important contract renewals.
Torii is the industry’s first all-in-one SaaS Management Platform, providing a single source of truth across Finance, IT, and Security.
Learn more by visiting Torii.
Frequently Asked Questions
SaaS sprawl refers to the rapid accumulation of multiple software subscriptions that overlap in functionality, leading to wasted budgets and unclear ownership.
A unified SaaS taxonomy organizes tools under consistent categories, improving accountability and reducing overlaps, saving time and costs during audits and renewals.
Function tags categorize each app by its primary features, enabling better visibility on overlaps and gaps across various teams, ultimately aiding in budget assessments.
By mapping apps to specific functions and using heat maps, companies can quickly spot redundant tools and streamline spending, ensuring more efficient resource allocation.
Tagging by risk allows companies to evaluate and prioritize applications based on their potential impact, ensuring that high-risk tools receive the necessary scrutiny.
Controlling SaaS spending involves mapping tools to cost centers, setting budget ceilings, and triggering alerts for unusual spending patterns or low-utilization licenses.
Torii's platform helps discover hidden apps, reduce costs by eliminating unused licenses, automate IT tasks, and ensure timely contract renewal alerts.