It's Time to Measure Real Usage: Introducing Torii Research
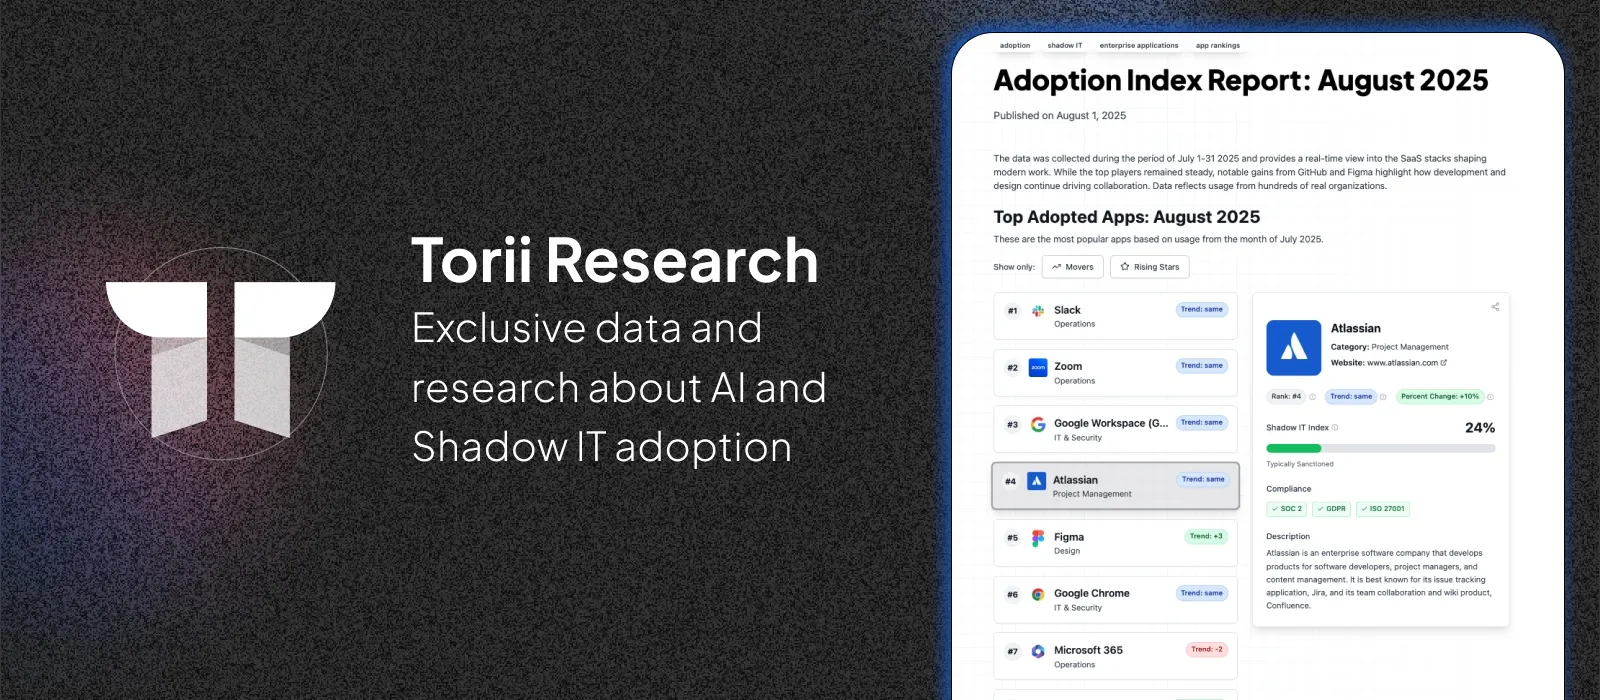
Introducing Torii Research: monthly, live rankings of workplace apps based on anonymized usage across hundreds of organizations—no surveys, no spin.
Ask about this article
Opens Claude in a new tab to answer, using this article as the source.
Real usage, not opinions.
If you make decisions about software—whether you’re in IT, finance, procurement, ops, or security—you don’t need more hype. You need a clear read on what people actually use inside real companies. That’s why we built Torii Research.
Check out toriiresearch.com
Starting today, we publish monthly, live rankings of workplace apps based on anonymized usage across hundreds of organizations.
No surveys. No vendor spin. Just signals you can trust.
Why Torii Research?
Buying software today is noisy. Vendors promote. Surveys lag. Opinions conflict. Meanwhile, your stack changes week to week, and “shadow” tools appear before anyone files a ticket.
Torii Research cuts through the noise. We show adoption patterns as they happen, so teams can:
- Spot apps that are spreading fast (and decide whether to lean in or rein them in).
- Compare categories month over month to see what’s rising or slowing.
- Prep renewals and evaluations with evidence, not guesswork.
What we publish each month
Under the App Adoption Index umbrella, you’ll find four reports:
- Adoption Index Report: This monthly report ranks the top 20 applications every month as measured by the number of orgs adopting the application. Each app is compared against a 12-month rolling average, so you see who’s truly outperforming the trend—not just having a one-off spike.
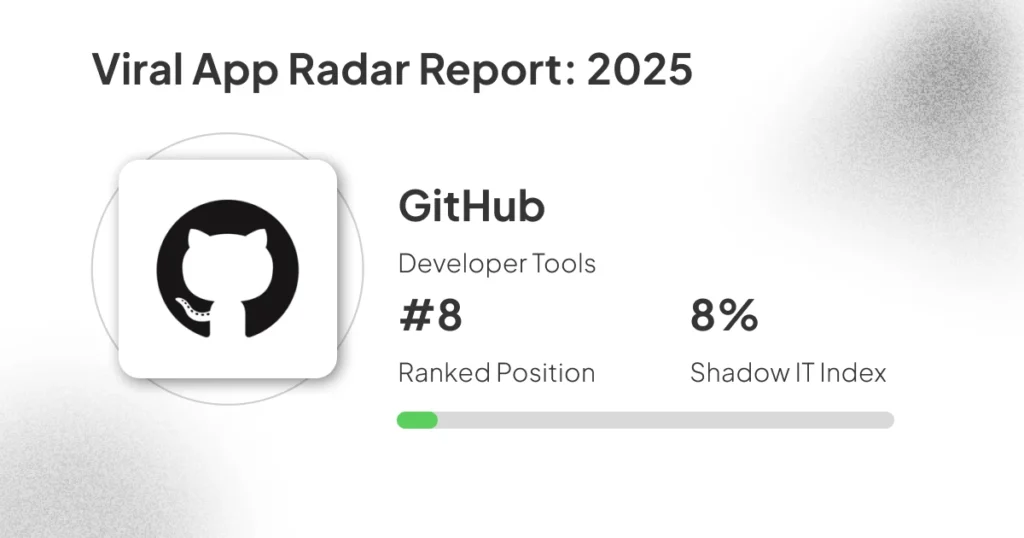
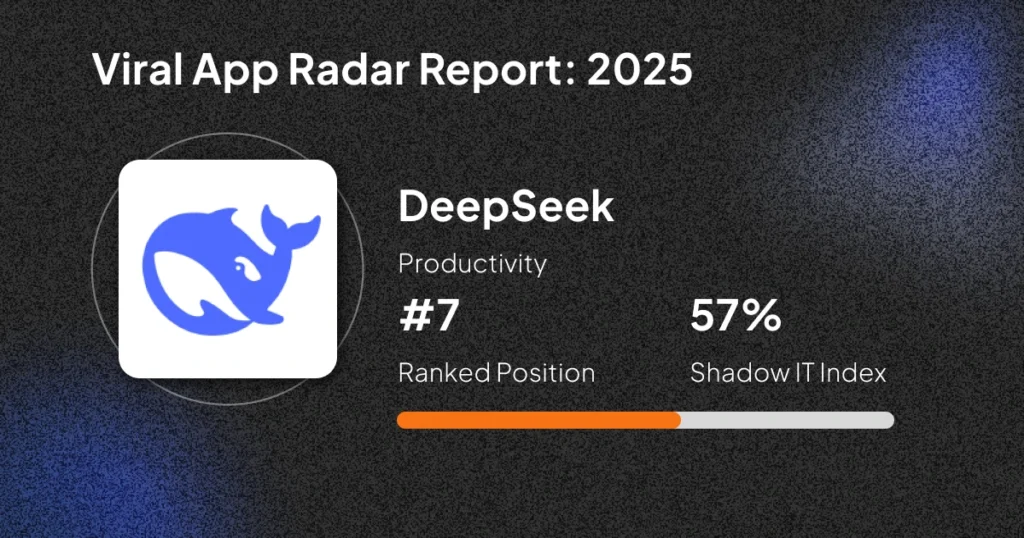
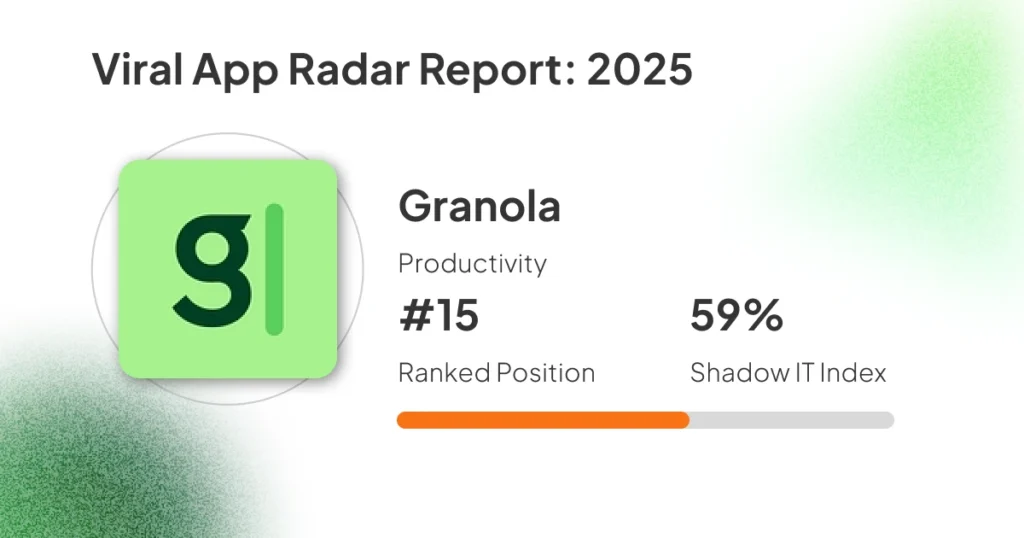
- Viral App Radar Report: This is an annual report that shows the fastest-growing apps inside companies. We combine the number of organizations that have the app, its growth rate within each organization, and a shadow-IT factor into a single score. Details live on the Methodology page.
- AI Breakout Report: The AI tools gaining real traction now. Expect churn here—new entrants appear often as teams try fresh models, agents, and workflows.
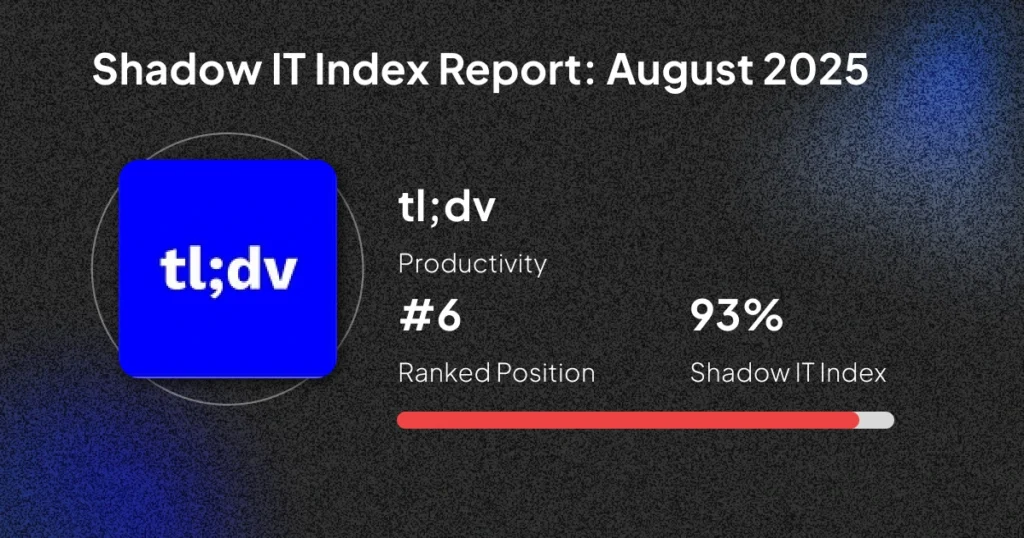
- Shadow IT Index Report: Which tools are most often discovered outside sanctioned SSO/procurement flows. We normalize for well-known staples (e.g., AWS, Slack) so the ranking highlights true outliers, not detection quirks.
Aggregated, Anonymized, and Real-World
Anonymized by design. Our analyses use de-identified, aggregated data only. No customer, account, user, or organization is ever identified or linkable in what we analyze or publish.
No account association—ever. Nothing in the Index ties usage back to any specific customer environment. We publish aggregate ranks, counts, and percentages, not customer- or user-level records.
Real usage, not surveys. Signals come from anonymized workplace activity across hundreds of stacks, giving a clearer read than opinions or vendor claims.
Rolling context. Where possible, we benchmark results against a 12-month rolling average to separate durable trends from one-off spikes.
Read the details: Methodology & FAQ.
Who this helps
- IT & Security: See what’s entering the stack before it becomes risk.
- Finance & Procurement: Prioritize renewals and negotiations with adoption facts.
- Ops & Team Leads: Understand what your people actually use to get work done.
What to look for this month
We’re kicking off with a broad view across categories—adoption, virality, shadow IT, and AI. If you’re tracking AI specifically, watch the AI Breakout Report for fresh entrants and fast movers; new names can show up quickly as teams experiment and operationalize workflows.
What’s next
We publish new rankings the first week of every month. Each drop includes highlights, charts, and links back to the full dataset and methodology.
- Explore the live Index: toriiresearch.com
- Get the monthly drop in your inbox: Subscribe on the site
- Press or research partner? Contact John Baker (john.baker@toriihq.com) to talk about early embargo access.
Torii Research exists for one reason: to make SaaS decisions clearer with real usage not opinions. Let’s measure what matters.
Related reading: