7 Finance-Focused SaaS Management Metrics Every IT Leader Should Track in 2026
Learn 7 finance-focused SaaS management metrics IT leaders must monitor to reduce costs, eliminate shelfware and prove ROI
Ask about this article
Opens Claude in a new tab to answer, using this article as the source.
Finance teams can’t rein in the SaaS bill without a clear, unified view of every subscription. With budgets under review, IT is being asked to surface every unused seat and every forgotten renewal.
Most dashboards still bury the cost and usage data finance needs. That leaves teams guessing instead of acting on facts. When metrics link directly to spend, use, and business impact, finance can move quickly. Pull contract terms, login events, and head-count numbers into one place, and both groups get answers in minutes.
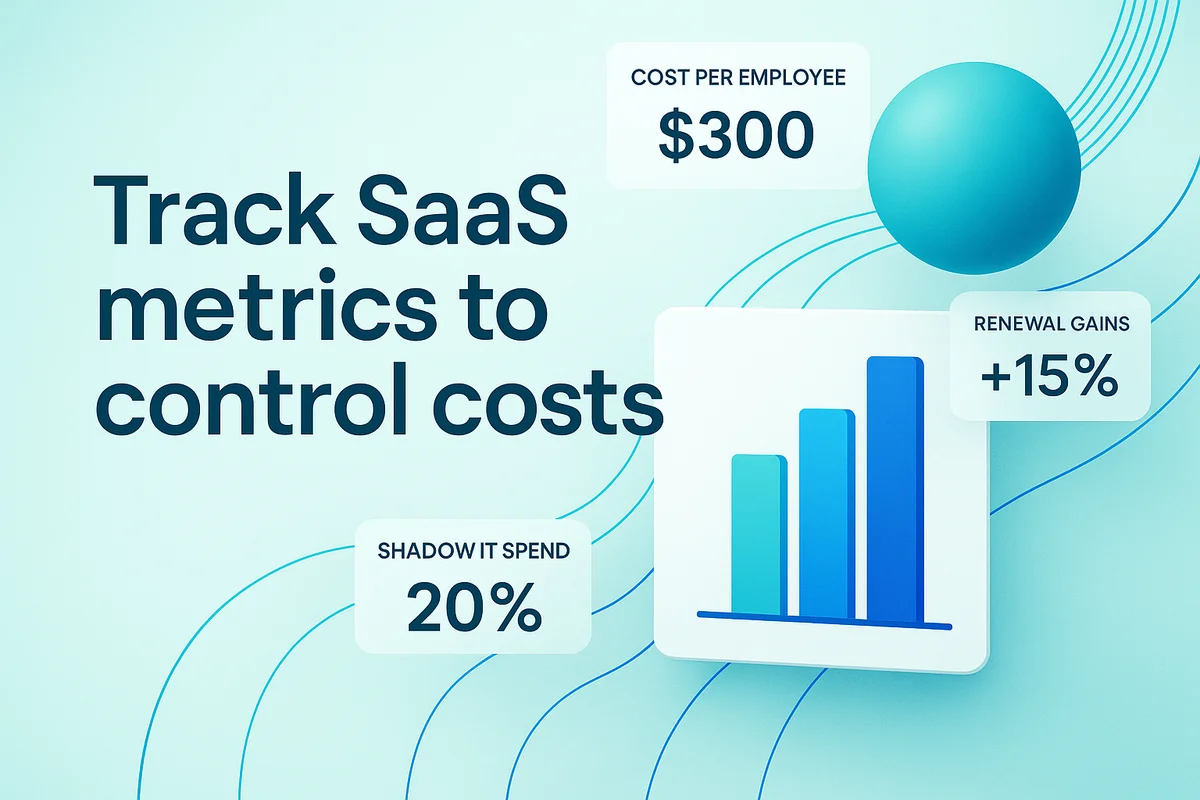
The seven metrics below give finance a fast reality check on SaaS ROI. They include cost per employee, license use rate, renewal savings, shelfware percentage, shadow AI spend, vendor-consolidation savings, and onboarding cost per app. Track them consistently to cut waste and keep the software portfolio lean and resilient. Shadow AI spend is the hardest line to pin down, since usage-based vendors bill per token — for Anthropic, dedicated Claude token tracking tools turn that fuzzy charge into a number finance can forecast.
Table of Contents
- Watching Cost per Employee Spend
- Boosting Your License Utilization Rate
- Capturing Renewal Savings at Negotiation
- Uncovering and Cutting Shelfware Waste
- Reining In Shadow IT Spend
- Finding Vendor Consolidation Savings Fast
- Measuring Onboarding Cost per App
- Conclusion
Watching Cost per Employee Spend
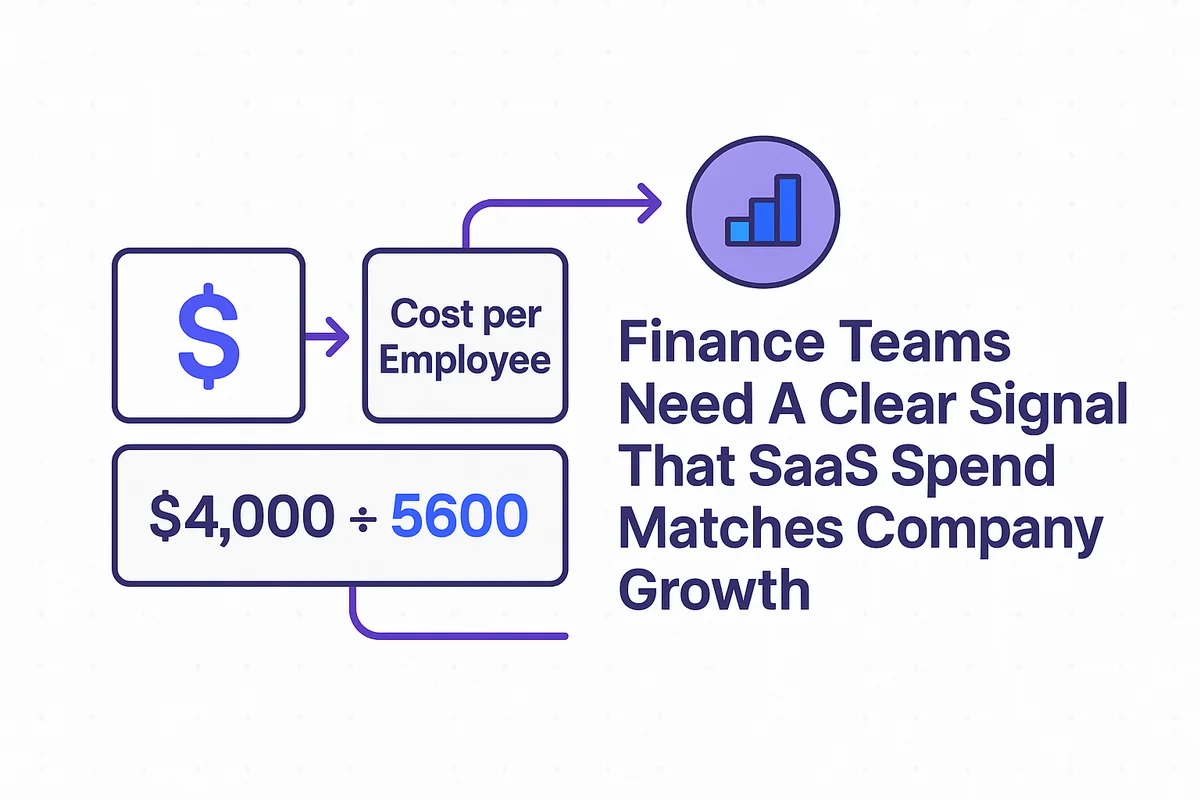
Finance teams need a clear signal that SaaS spend is matching company growth.
Cost per employee delivers that signal: divide annualized SaaS spend by active headcount for a number everyone understands. When a company spends 4 million dollars a year on SaaS for 1,000 workers, the metric lands at 4,000 dollars; simple math, fast clarity.
Numbers lose value when they age, so refresh the head-count denominator every month as HRIS records change. A hiring surge can make an inflated ratio look stable, while a layoff hides overspend by shrinking the base. Benchmark the figure against last quarter’s budget or public data (Blissfully’s 2023 report pegs the median tech firm at about 5,600 dollars) to spot drift early.
The metric highlights more than raw cash:
- Tracks whether per-employee SaaS spending climbs faster than the company’s revenue growth rate.
- Flags when departmental buying sprees outpace planned budgets.
- Shows potential impact of planned hiring freezes or expansions.
- Signals when approaching, meeting, or breaking internal cost ceilings.
A SaaS management platform links HRIS headcount with real-time invoice data and plots the ratio on a live dashboard. Finance sets a threshold, for example 10 percent over plan, and the tool pings Slack the moment the line gets crossed. Owners see which contracts pushed the metric over the edge, no spreadsheet hunting required.
When the alert fires, act before renewal season locks in another year of excess. Combine plans, ask vendors to move you from premium to pro tiers, or bundle products under one agreement to reclaim scale pricing. Even a modest five-percent cut on a high-volume suite can push cost per employee back in line and produce ROI the board notices.
Boosting Your License Utilization Rate
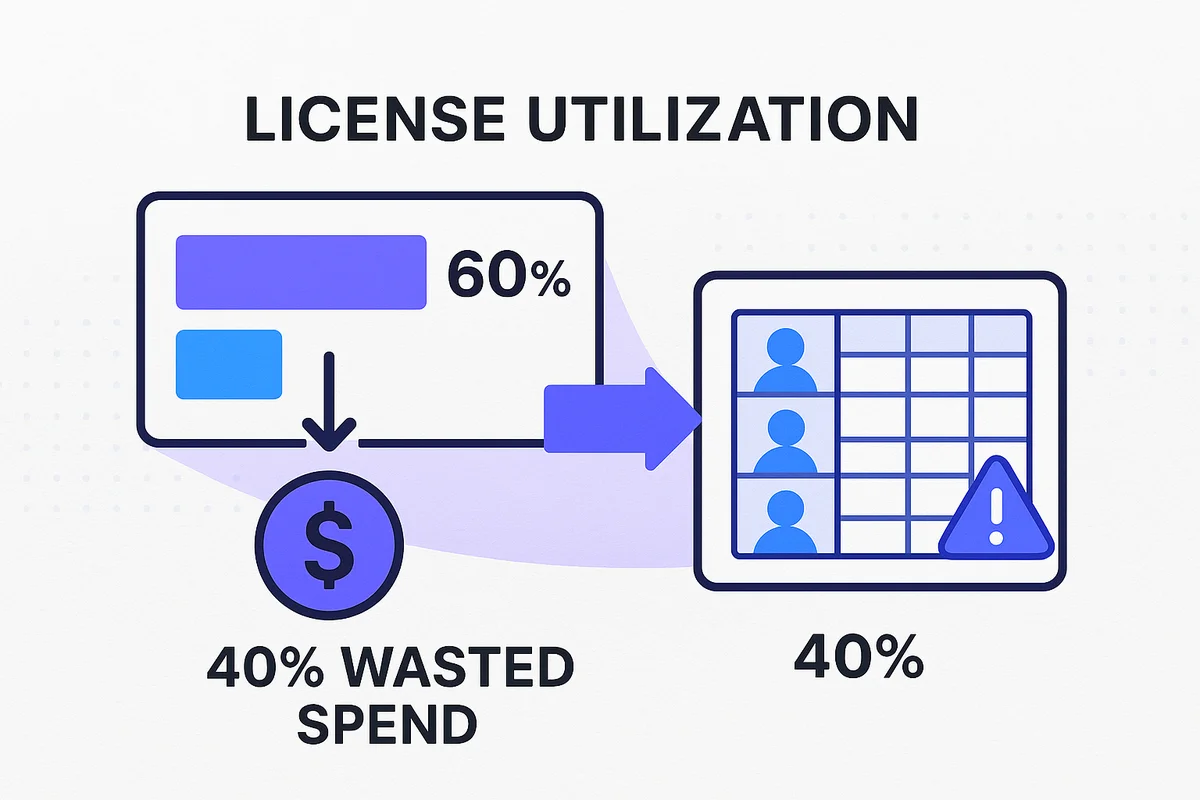
License Utilization shows the gap between paid seats and the seats people really use. Divide the number of users who logged in during the measurement window by the total seats on the invoice to get the ratio. Track it for each app first, then roll the math into a portfolio snapshot so leaders can spot drag across the stack.
Usage data, when placed next to the invoice total, reveals waste in plain numbers. A 60 percent use rate means forty cents of every dollar spent on that tool slips away, yet Gartner still cites that figure as the industry norm. Aiming for 85 to 90 percent unlocks quick savings because each reclaimed seat cuts cost without denting productivity; OpsRamp recouped almost $300,000 after one audit flagged idle Salesforce licenses.
Manual counts fail fast once user numbers climb past a few hundred. A SaaS management platform steps in by pulling authentication logs from Okta, Azure AD, or Google Workspace, matching them to contract records, and flagging seats that stay dark beyond a policy window, often 30 days for daily-use tools or 90 days for quarterly apps. After a seat is flagged, automated workflows can deprovision the account, update the shared license pool, and alert the budget owner, making cleanup a steady habit instead of a frantic, twice-a-year chore.
A few scenarios justify running below 80 percent use briefly:
- Strategic buffer for a product launch that will onboard many users overnight
- Extra test seats reserved for QA or staging environments during active development
- Temporary over-purchasing to secure volume pricing ahead of an acquisition close
Still, treat those exceptions as deliberate, documented choices, not creeping waste. Bake the use metric into monthly business reviews so teams feel the pinch of idle spend early. After a few cycles, product owners start booking seat audits well before renewal dates, IT gains bandwidth otherwise spent chasing spreadsheets, and finance finally sees a clear line between usage patterns and cash out the door.
Capturing Renewal Savings at Negotiation
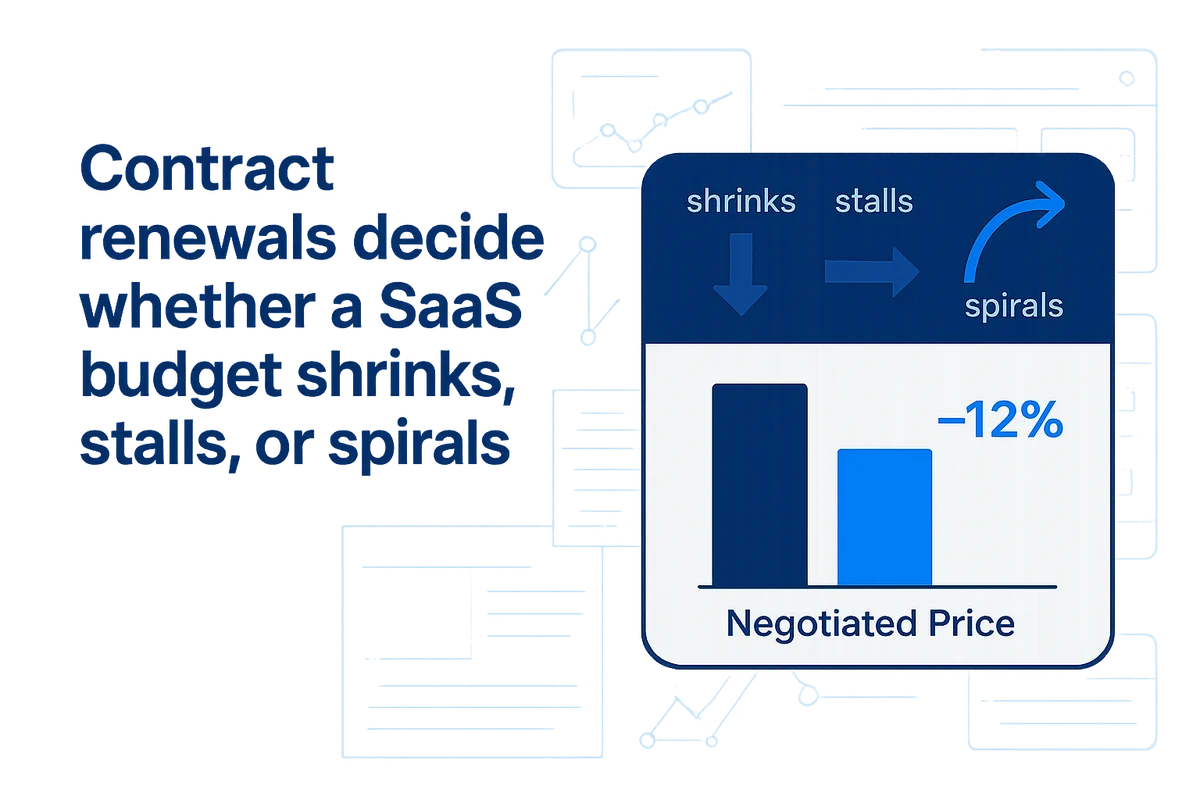
Contract renewals decide whether a SaaS budget shrinks, stalls, or spirals.
Procurement teams track that swing with a Renewal Savings metric that stacks today’s negotiated price against the last contract. First they log the change in raw dollars, then as a percentage of previous spend. Capturing both hard savings, like a 12 percent unit-price cut, and soft savings, such as free API calls or premium support, turns a single deal into a data point that procurement can map to annual OKRs. When finance sees quarter-over-quarter savings presented this way, leaders stop guessing about ROI and start forecasting it.
Targets get far easier to hit when the calendar cooperates. A SaaS Management Platform syncs every renewal date, surfaces benchmark pricing, and pings owners 90, 60, and 30 days out. Those early warnings buy time for competitive quotes, legal review, and security checks that often stretch beyond the vendor’s auto-renew window. The same platform also records previous concessions so negotiators never walk in blind.
There are several common levers that can push Renewal Savings higher, including:
- Asking suppliers to bundle adjacent product lines into a single master agreement
- Extending term length from one to three years in exchange for deeper tier discounts
- Committing to growth bands that match realistic hiring projections rather than vendor-set upsell quotas
- Trading public case studies or webinar appearances for add-on features without extra cost
Uncovering and Cutting Shelfware Waste
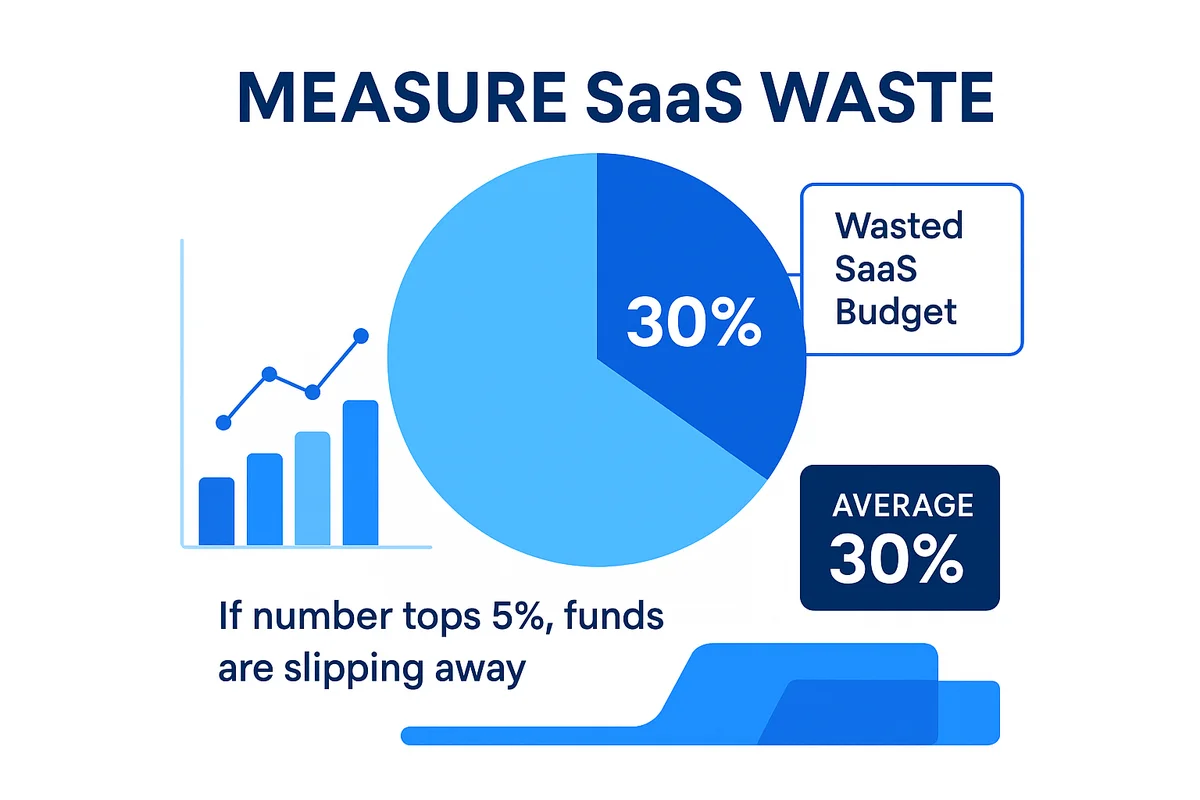
SaaS licenses often linger unused, draining budgets long after original champions have stopped logging in. Measure the waste with a quick ratio: divide the annual contract value of every app showing zero activity for ninety days by total SaaS spend. If the number tops five percent, funds are slipping away, and Gartner puts the average near thirty, so the payback for cleanup is big.
Most shelfware starts with scattered purchasing decisions across well-meaning teams. A marketing manager puts a webinar platform on a card, the product group trials five prototyping tools, and no one cancels when the project wraps. Those small charges keep rolling in, hiding among minor receipts that never reach the approved catalog, leaving finance without leverage and security without visibility.
Dedicated SaaS management software finally brings that sprawl into sharp focus. It matches authentication logs, expense feeds, and contract data in real time, spotting dollars that leave without sign-ins returning. When that happens, the system marks the contract dormant and kicks off a decision workflow. Typical next steps include:
- Notify the budget holder with last-login data and renewal date.
- Trigger a deprovisioning request in Okta for inactive users.
- Generate a termination letter and route it to procurement.
- Update the shelfware dashboard so finance tracks reclaimed spend.
Quarterly audits stop the shelfware ratio from creeping upward again. Teams that pair automated alerts with a written policy, such as shutting tools off after ninety idle days unless justified, recover budget in the current fiscal year rather than the next. Less ghost software frees capital for projects that genuinely move the business forward.
Reining In Shadow IT Spend
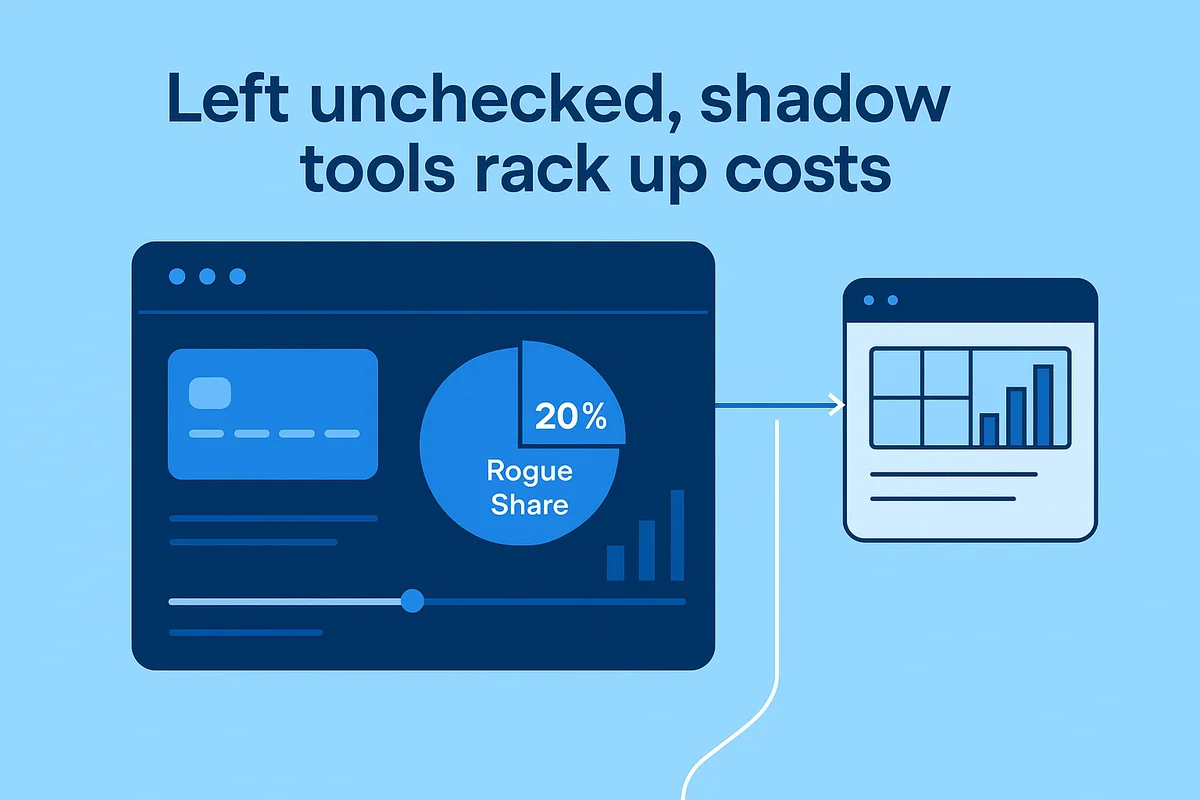
Shadow IT spend often slips through review because it blends into everyday card statements. Finding it comes down to one calculation: total each charge or reimbursement tied to an unsanctioned SaaS product, then divide that sum by overall SaaS spend to get the rogue share. Cisco AppDynamics reported a 20-percent worldwide average in 2023, yet high-growth teams can sail past 40 percent because finance codes every subscription the same.
A SaaS management platform tackles the hide-and-seek game by syncing with ERP, expense, and corporate card feeds. It tags each transaction against the approved app catalog, flags unfamiliar vendors, and adds context such as user, department, and renewal date. Alerts then land with the security or procurement owner, who can approve the charge, fold it into an enterprise deal, or shut it off. Because that loop runs automatically, finance sees the story at month-end instead of getting a rude surprise next quarter.
Left unchecked, shadow tools rack up costs that stretch far past the payment line.
- Overlapping tools: three note-taking services even though Microsoft 365 covers the need
- Lost volume pricing: Canva Pro seats bought ad hoc instead of one enterprise plan
- Security gaps: forgotten OAuth tokens in abandoned trials
- Audit headaches: unvetted processors that break SOC 2 or GDPR promises
An unsanctioned swipe on the corporate card isn’t automatically a problem. Quick experiments often fuel new ideas, but they need a guardrail. Many IT leaders draw a line, such as one percent of the SaaS budget or any single charge above $500, before triggering review. Anything smaller can run for thirty days, giving teams space to test while risk stays contained. Once usage or spend crosses the limit, consolidation talks start and finance folds the tool into a formal contract or steers users to something already in house.
Track shadow IT with the same rigor applied to approved contracts. You’ll bank real savings, tighten security, and walk into renewals with extra leverage.
Finding Vendor Consolidation Savings Fast
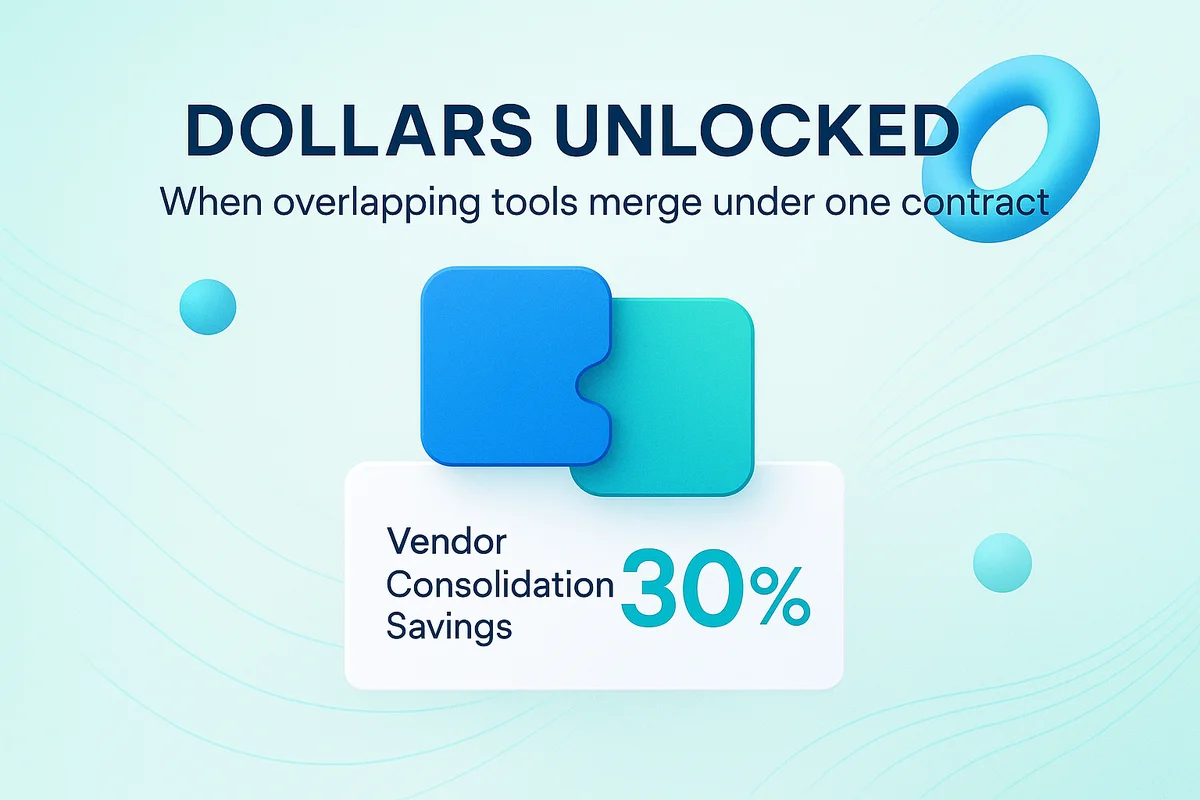
Vendor consolidation savings reveal dollars unlocked when overlapping tools merge under one contract. In many teams, those unlocked dollars quickly fund projects that sat in budget limbo for months.
On paper, running the numbers feels straightforward for any analyst: add the annual spend of every overlapping tool, subtract the quoted price of the replacement platform, then deduct one-time migration costs. Divide the result by the original combined spend to get the percentage saved. Finance teams usually tack on a payback period by dividing migration costs by monthly savings, so a nine-month breakeven on a three-year contract is easy to spot.
A SaaS management platform removes much of that guesswork by pulling real data from contracts. It tags each subscription by category (project management, file storage, digital signature) and surfaces actual license counts and renewal dates. When the platform spots five e-signature tools with 500 total seats, it models what 500 Docusign Business Pro seats would cost, including tiered discounts tied to a co-term renewal.
- Current combined spend
- Future state contract price
- Migration and enablement costs
- Savings timeline and payback period
- Feature gaps or must-have add-ons
Numbers never tell the whole story, so teams pressure-test hidden costs before signing. Migration services, user retraining, data exports, and potential feature downgrades can erode headline savings if they slip through scoping.
Seasoned vendors understand just how much pricing leverage a consolidation project can create. Flashing a competitor’s bundled quote can unlock volume discounts north of 30 percent, especially when renewal clocks are ticking. Still, finance leaders document every assumption and revisit the model three months after go-live to confirm that license counts, support tickets, and adoption trends line up with the forecast. Without that follow-through the projected savings remain a spreadsheet myth rather than cash returned to the business.
Measuring Onboarding Cost per App
Every new SaaS logo adds a hidden line item most budgets miss. The procurement team signs, the app goes live, and a quiet marathon of setup meetings, role mapping, security reviews, and training videos begins long before the first user clicks “Sign In.”
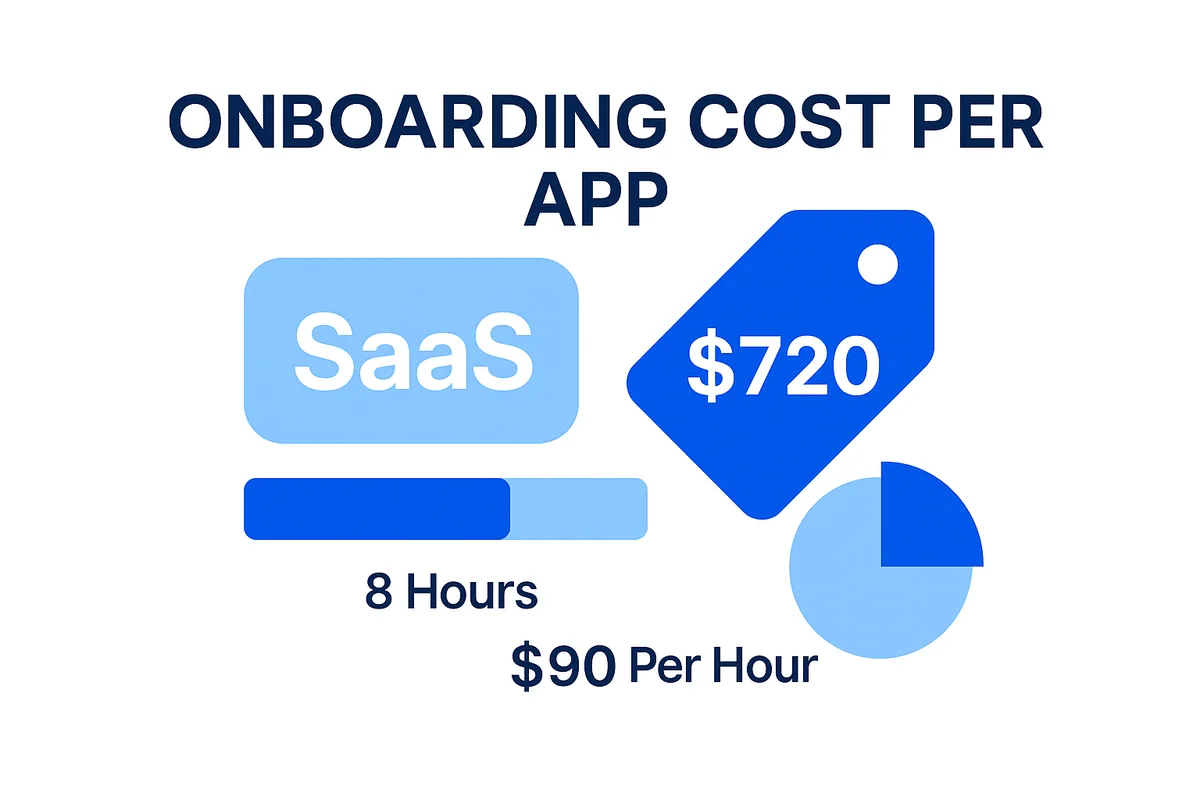
Onboarding Cost per App puts a price tag on that marathon. Add the hours spent by IT, HR, and departmental trainers, multiply each by its loaded hourly rate, include enablement tool fees such as Loom or WalkMe, then divide by the number of applications launched during. A $90-per-hour engineer sinking eight hours into a single rollout already contributes $720; multiply that across roles and the figure rises quickly.
Putting a dollar figure to onboarding brings uncomfortable decisions to light early. If onboarding ServiceNow demands twice the spend of Jira but serves a smaller audience, finance can challenge the business case early instead of chasing savings later. Okta’s 2023 Business at Work report counts 89 apps in the average enterprise stack, so even a modest $500 onboarding cost balloons to $44,500 each year.
The right SaaS management platform can cut both hours and headaches. By syncing to your HRIS, it bundles role-based access, spins up accounts through API calls, and pushes one set of usage guides to Slack channels the moment a user is provisioned. Then it tags every automation step with the minutes saved, a metric finance believes.
- Publish a quarterly onboarding budget and socialize it with department heads.
- Refuse new app requests that would exceed the budget without offsetting retirements.
- Track onboarding cost reduction alongside license use in the same dashboard to reveal full lifecycle efficiency.
- Use the data to negotiate vendor-funded implementation help; Atlassian often grants free Enablement Credits when spend crosses certain tiers.
Set a 20 percent reduction target and report progress in QBRs next to traditional savings metrics. When executives see onboarding cost drop while productivity rises, they stop equating “more apps” with “more value” and start rewarding the teams that make the stack simpler, cheaper, and quicker to adopt.
Conclusion
Seven numbers guide every IT leader who wants to control SaaS costs. Track cost per employee, watch seat use, record renewal gains, and identify shelfware so cash stops leaking. Surface shadow IT spend, model tool swaps, and log every hour poured into onboarding.
When finance and security see the same dashboards, the talk moves from gut instinct to evidence, and renewal meetings start on your terms. Review the numbers often and your SaaS management program will show real ROI while trimming waste.
Audit your company’s SaaS usage today
If you’re interested in learning more about SaaS Management, let us know. Torii’s SaaS Management Platform can help you:
- Find hidden apps: Use AI to scan your entire company for unauthorized apps. Happens in real-time and is constantly running in the background.
- Cut costs: Save money by removing unused licenses and duplicate tools.
- Implement IT automation: Automate your IT tasks to save time and reduce errors - like offboarding and onboarding automation.
- Get contract renewal alerts: Ensure you don’t miss important contract renewals.
Torii is the industry’s first all-in-one SaaS Management Platform, providing a single source of truth across Finance, IT, and Security.
Learn more by visiting Torii.
Frequently Asked Questions
Cost per Employee is calculated by dividing annual SaaS spend by active headcount, helping finance teams understand if spending aligns with company growth.
License Utilization Rate is determined by dividing the number of active users by the total seats in a subscription, indicating how effectively licenses are being used.
Renewal Savings quantify the financial benefits gained from negotiating better contract terms compared to previous agreements, expressed in both dollar amounts and percentages.
Shelfware refers to unused licenses that continue to incur costs, often due to scattered purchasing decisions without cancellation of inactive subscriptions.
Shadow IT involves the use of unauthorized SaaS applications by employees, making it difficult for finance to track hidden expenses and potential security risks.
Vendor Consolidation Savings are determined by analyzing the combined spend of overlapping tools and the costs of a unified replacement, revealing potential cost efficiency.
Onboarding Cost per App quantifies total expenses incurred during the setup of a new application, helping to assess its financial viability against benefits.