

11 Ways to Use Torii's AI Management Platform
 John Baker
•
Sep 28, 2026
•
13 min read
•
Updated September 28, 2026
John Baker
•
Sep 28, 2026
•
13 min read
•
Updated September 28, 2026
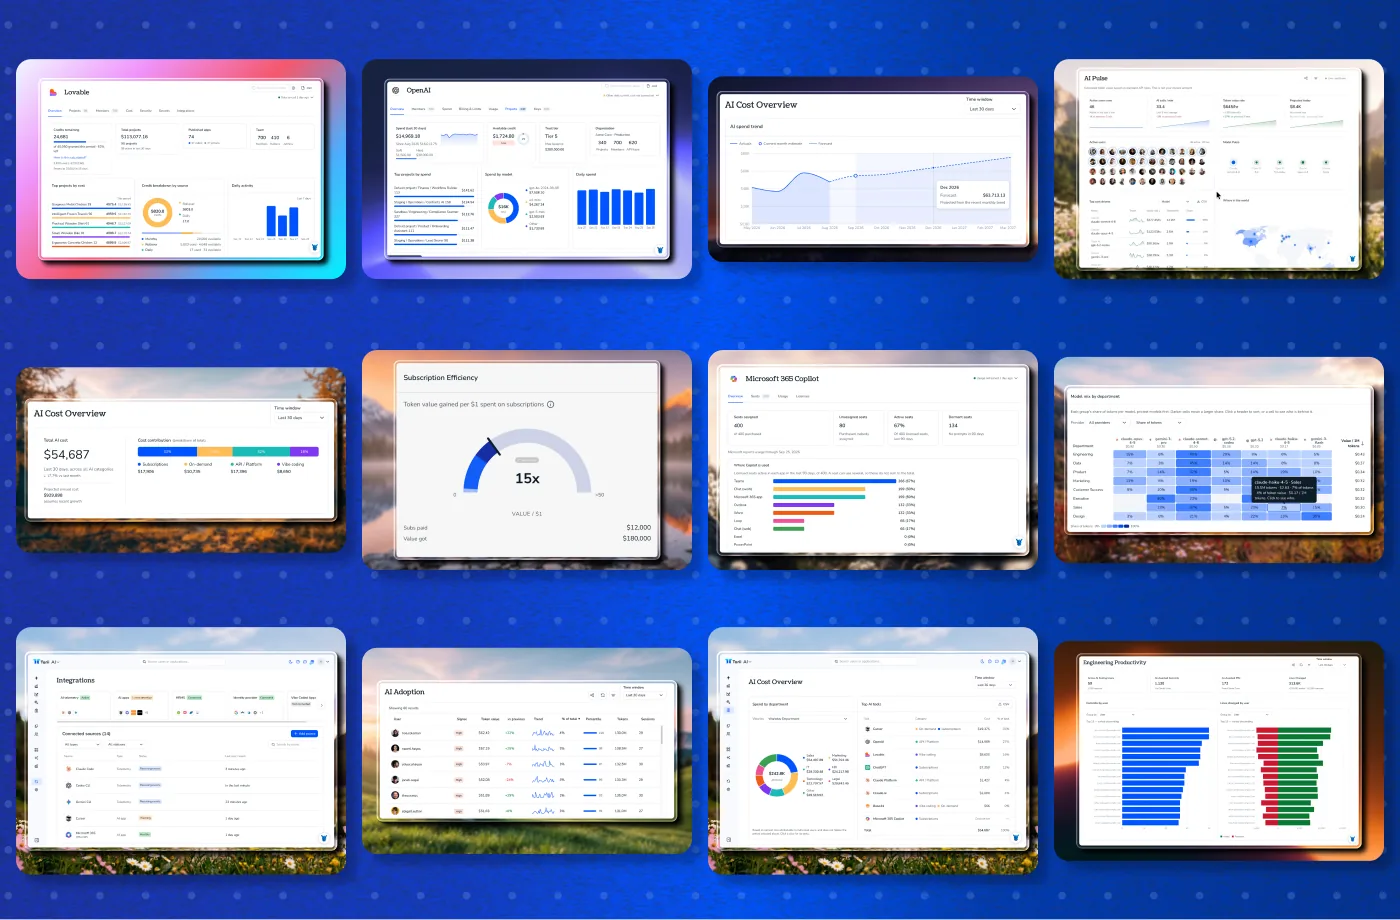
Torii's AI Management Platform gives you one live view of who is using which AI tools, what it costs, and whether it's paying off. Here are 11 ways to put it to work.
Ask about this article
Opens Claude in a new tab to answer, using this article as the source.
Your company runs on AI now. ChatGPT in marketing, Cursor in engineering, Claude in legal, and a Lovable app someone in RevOps built over a weekend that half the sales team now depends on. The bills are real and they keep climbing. The visibility? Not so much.
Torii’s AI Management Platform closes that gap. It pulls AI usage and spend from browser-based tools, developer CLIs, vendor admin APIs, and the integrations you already run. Then it cross-references everything against your HRIS, your identity provider, and your financial data, so you get one live view of who is using what, what it costs, and whether it’s paying off.
The AI Module hit general availability on September 3, 2026, and the updates haven’t slowed down since. Here are 11 ways to put it to work, from the first “wait, we use how many AI tools?” moment all the way to governing the apps your non-engineers are vibe coding.
The 11 at a glance
- Find every AI tool in the building
- Put a name and a team on every dollar
- Break your AI bill into the four ways AI charges you
- Forecast next quarter’s AI spend before the budget fight
- Give every department its own AI spend story
- Learn what your power users know
- Get full value out of every AI seat
- Coach adoption instead of just counting it
- Bring engineering’s AI coding agents into view
- Go deep on any single AI vendor
- Bring vibe coding out of the shadows
Part 1: See it, then price it
1. Find every AI tool in the building
You can’t manage what you can’t see, and AI is the fastest-growing blind spot in the stack. Torii’s own data found 694 new AI-native apps in 2025, and 26 of the top 50 shadow apps are pure-play AI. Odds are good some of them are already running in your org.
Source: Torii SaaS Benchmark Annual Report 2026, covering January to December 2025.
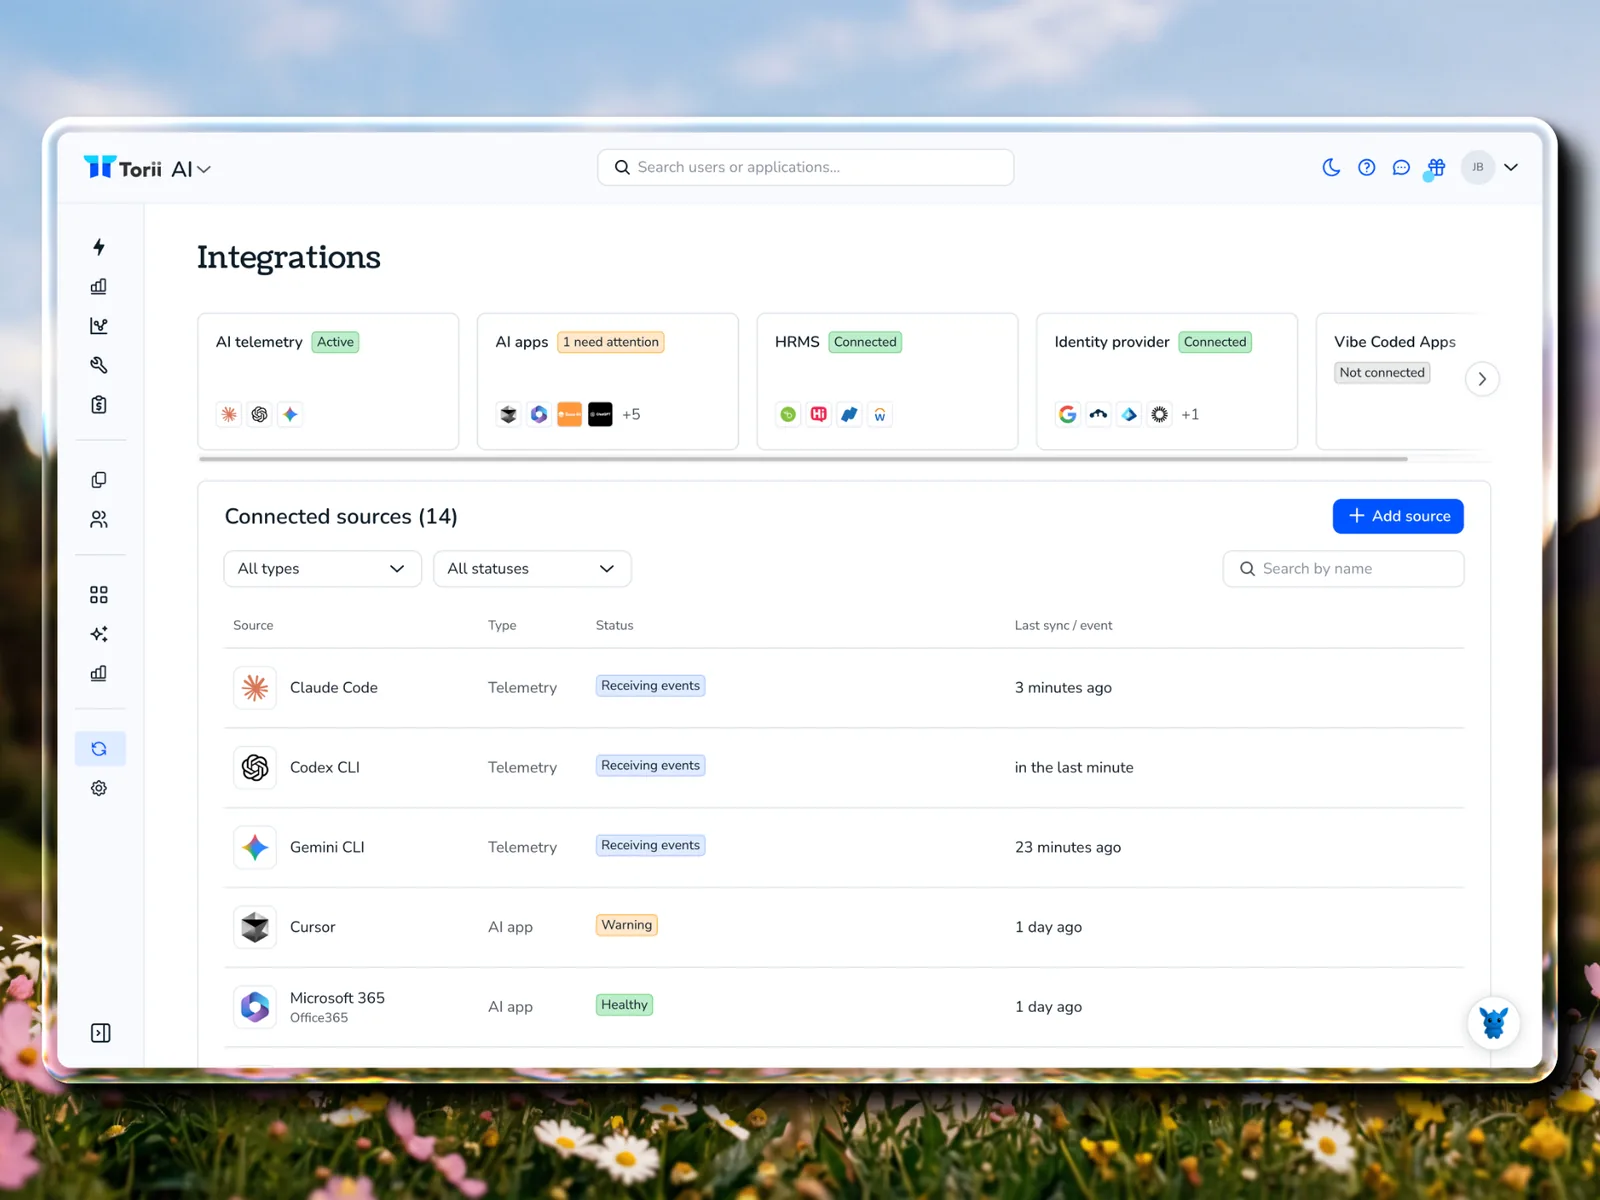
Torii maps your AI footprint from four directions at once:
- The Torii AI Lens browser extension picks up SaaS AI platforms like OpenAI, ChatGPT, Claude, Cursor, Lovable, and Base44.
- AI Telemetry tracks developer CLIs like Claude Code, Gemini CLI, and Codex.
- Vendor admin APIs bring in what each vendor actually bills you.
- Integrations you already have do double duty. Microsoft 365, for example, now feeds Copilot adoption data with zero extra setup.
That includes the tools nobody expensed. Torii flags unapproved AI in active use, even when it never touched a corporate card.
Why it matters: your AI inventory stops being a guess. IT, security, and finance all start from the same list.
2. Put a name and a team on every dollar
A big AI invoice raises one question fast: who did this? Torii answers it. Usage and spend are cross-referenced against your HRIS and identity provider, so every token rolls up to a person, a department, a manager, and a cost center.
And for the spend that doesn’t belong to any one person? The Cost Overview now has an Unattributed category. Click it and you get a breakdown by tool that explains why the cost landed there: org-level API usage, service accounts and automations, or credits billed at the workspace level. No more mystery line items.
Why it matters: chargebacks and budget conversations start with facts instead of finger-pointing.
3. Break your AI bill into the four ways AI charges you
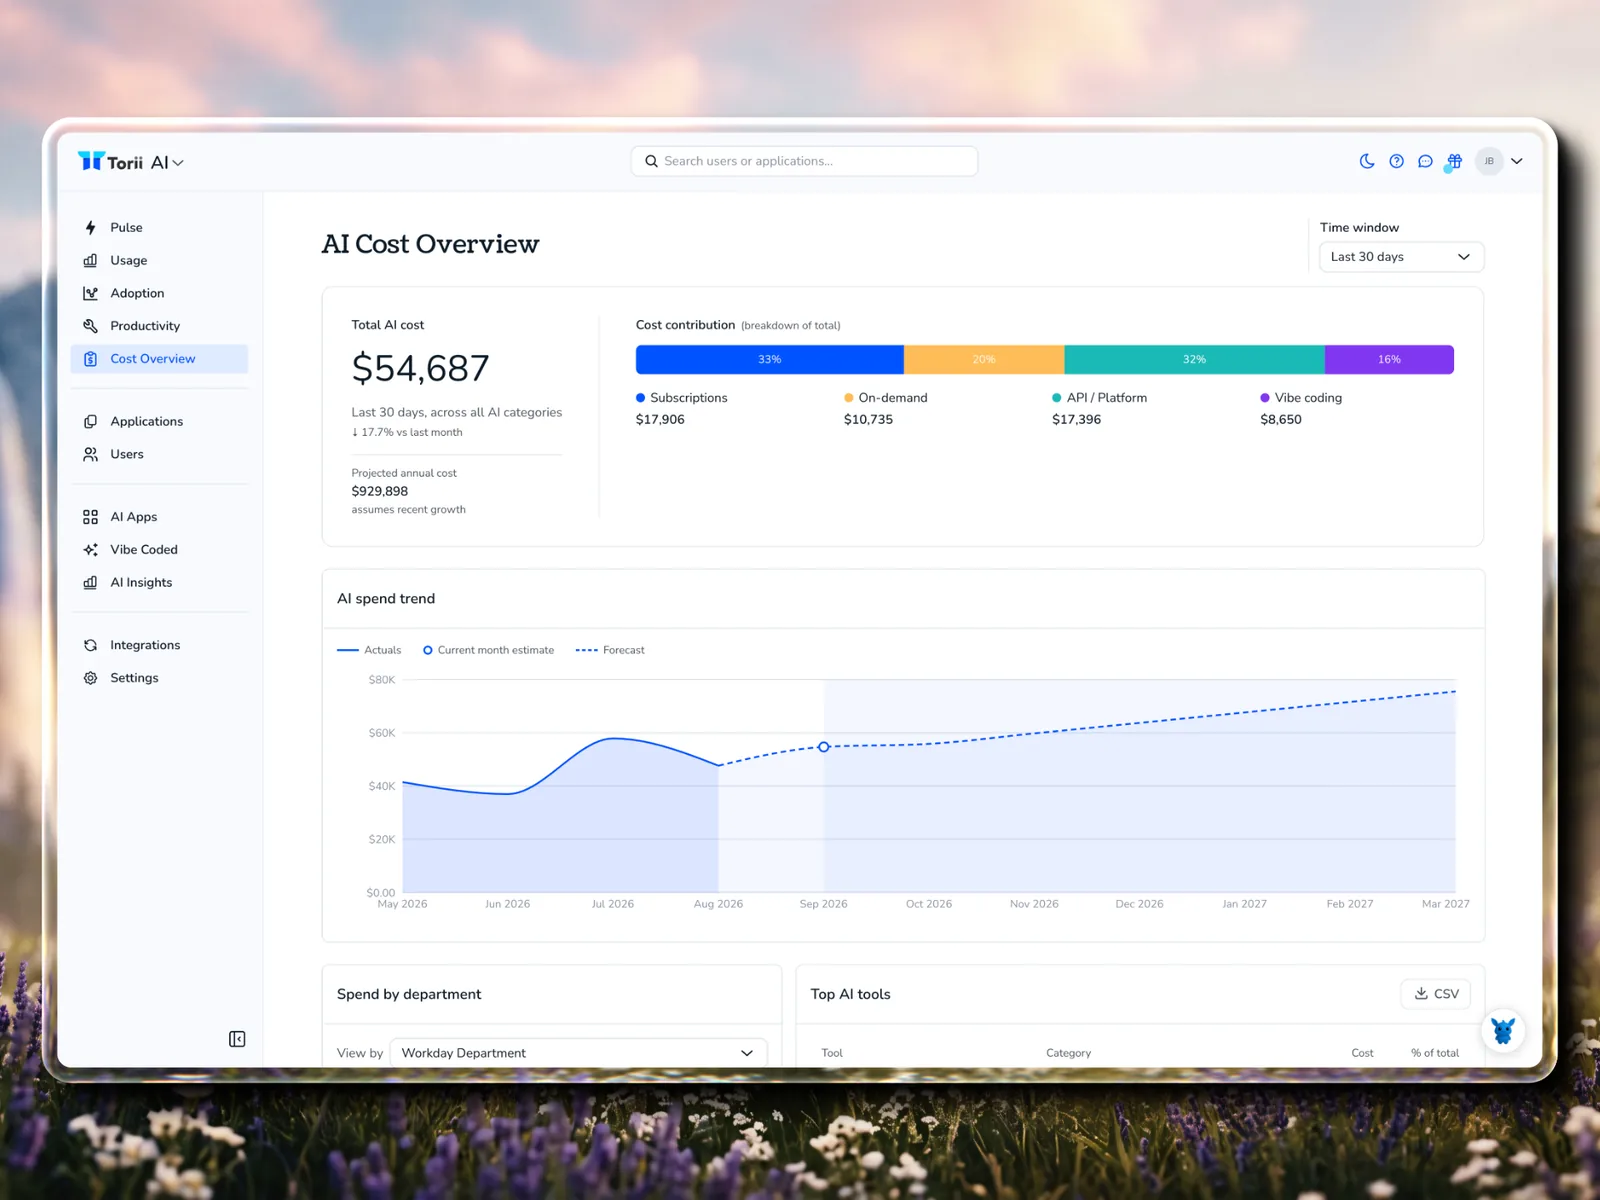
AI doesn’t bill like SaaS. One tool charges per seat, another burns credits, a third meters every API call. Torii’s Cost Overview shows your total AI cost and splits it into:
- Subscriptions (the seats you pay for every month)
- On-demand credits (usage that runs past the plan)
- API and platform costs (metered model usage)
- Vibe coding (credits on platforms like Lovable)
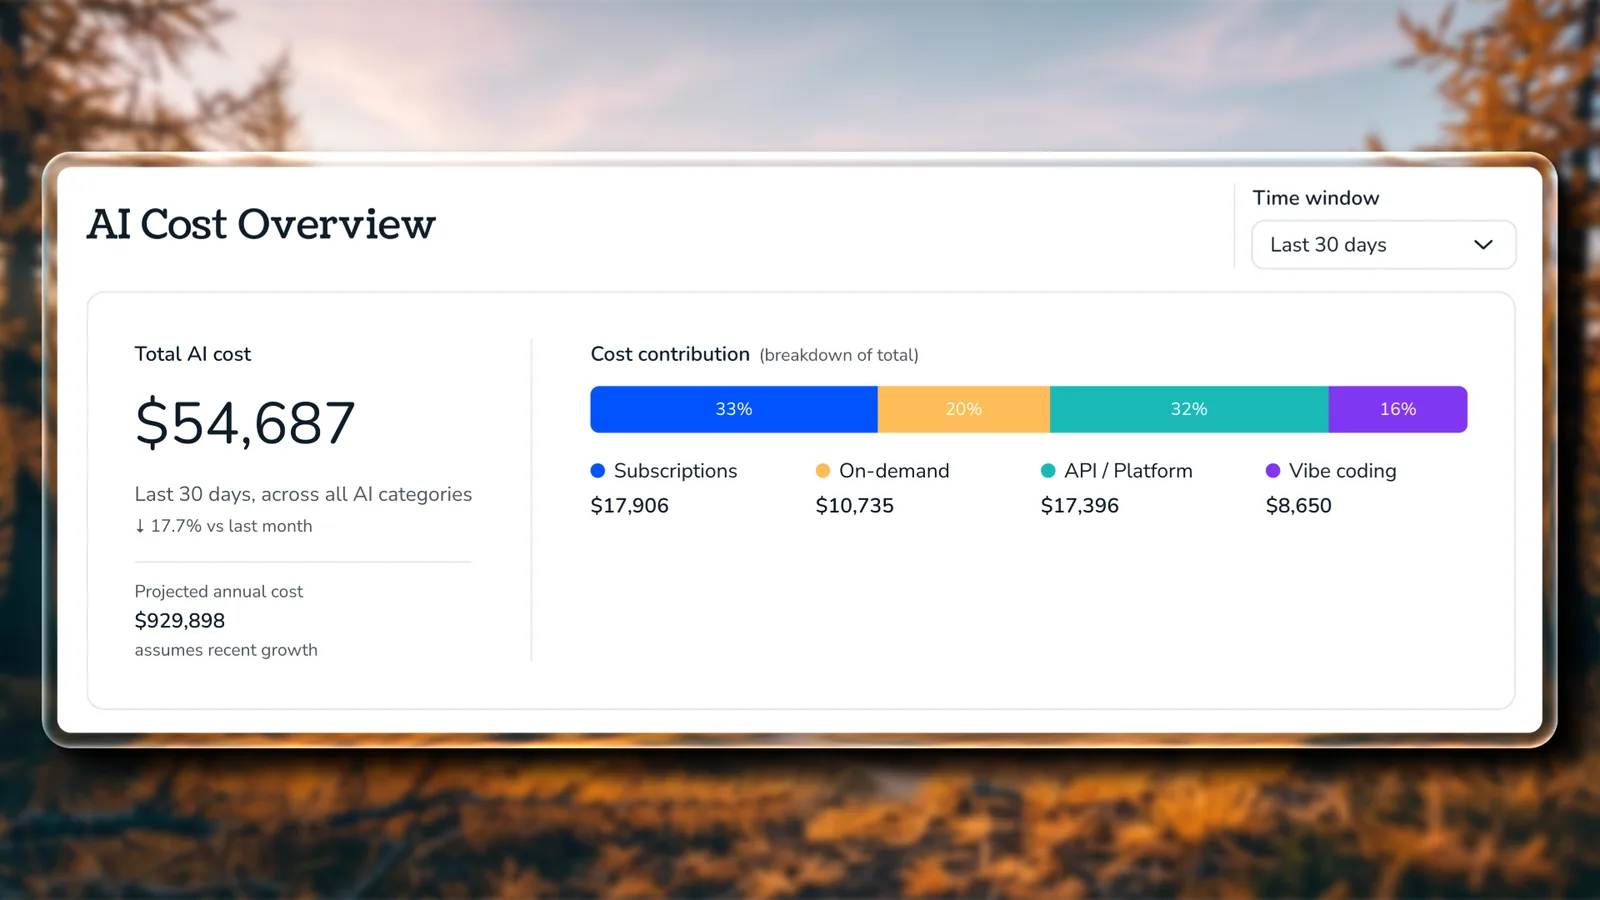
Here’s the insight that makes this view so useful: as an AI program matures, spend tends to shift from subscriptions toward API and on-demand usage. Watching that mix over time tells you where your program actually is, not just what it costs.
For Cursor, OpenAI, Claude Platform, and Claude.ai, Torii syncs billed costs straight from the vendor admin APIs, daily, in USD. That’s the real invoice number, not an estimate.
Why it matters: you can explain your AI bill in one slide, and you can see which cost model is growing fastest.
4. Forecast next quarter’s AI spend before the budget fight
Torii tracks your AI spend over time and projects where it’s headed, so you know which numbers you’ll be debating next quarter before the meeting gets booked.
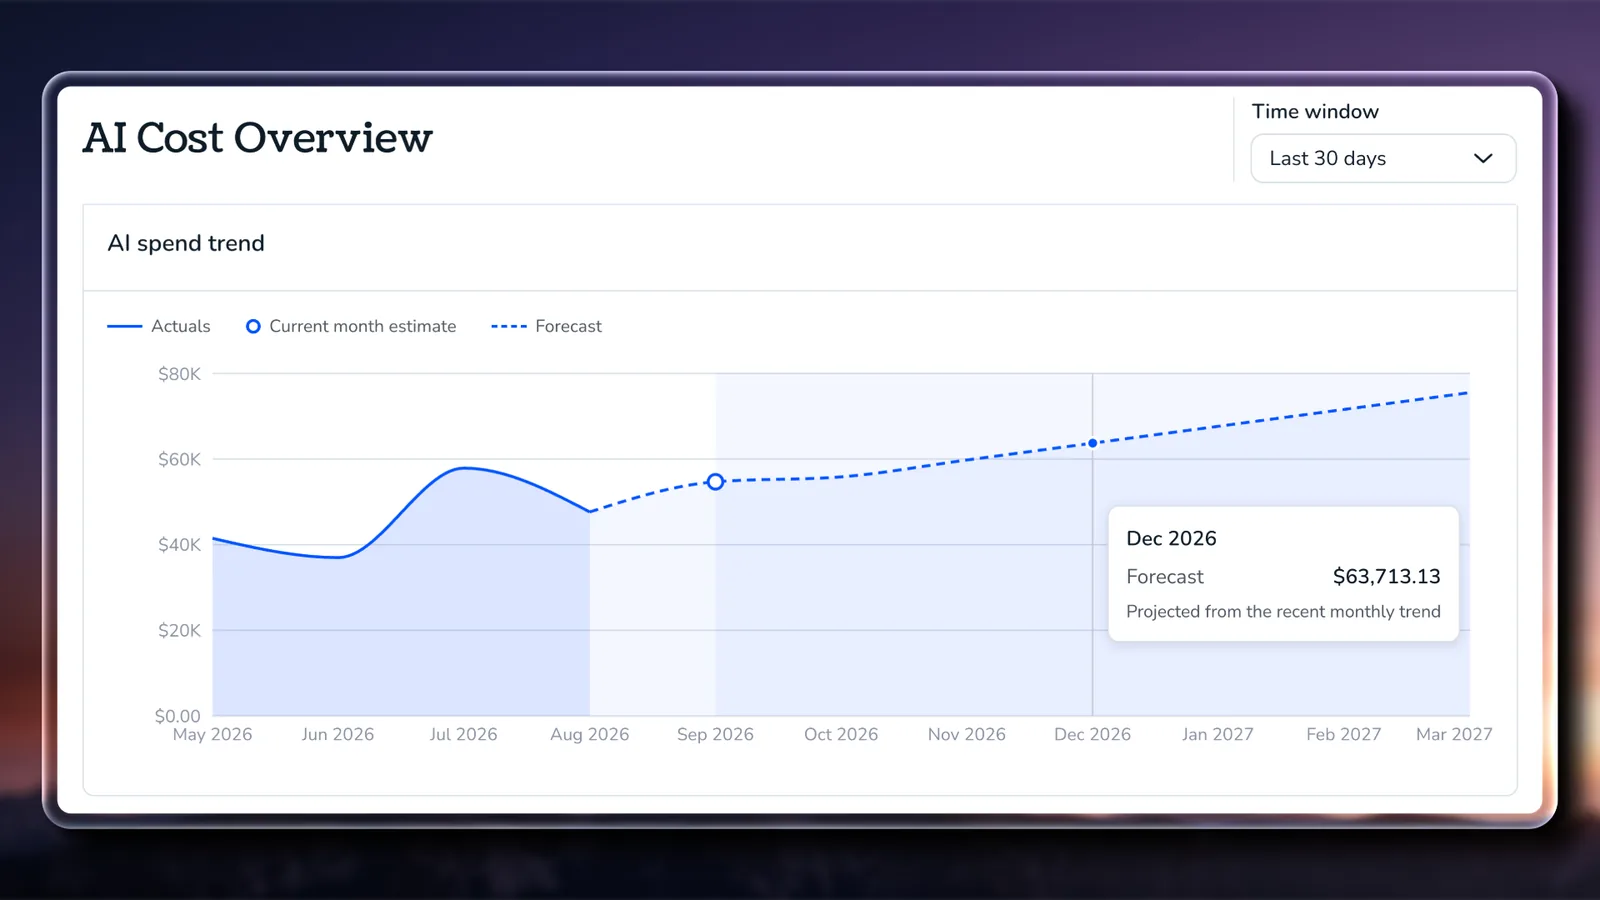
Two recent updates make this a finance team favorite:
- Finance-aligned time periods. Pick “Last month,” “Quarter to date,” or “Last quarter” to line up AI reporting with vendor invoices and your close.
- Export any AI Module table to CSV. Spend tables, adoption dashboards, and connected tool data drop straight into your planning model.
Why it matters: AI spend becomes something you plan for, not something that surprises you.
Part 2: Understand the people behind the usage
5. Give every department its own AI spend story
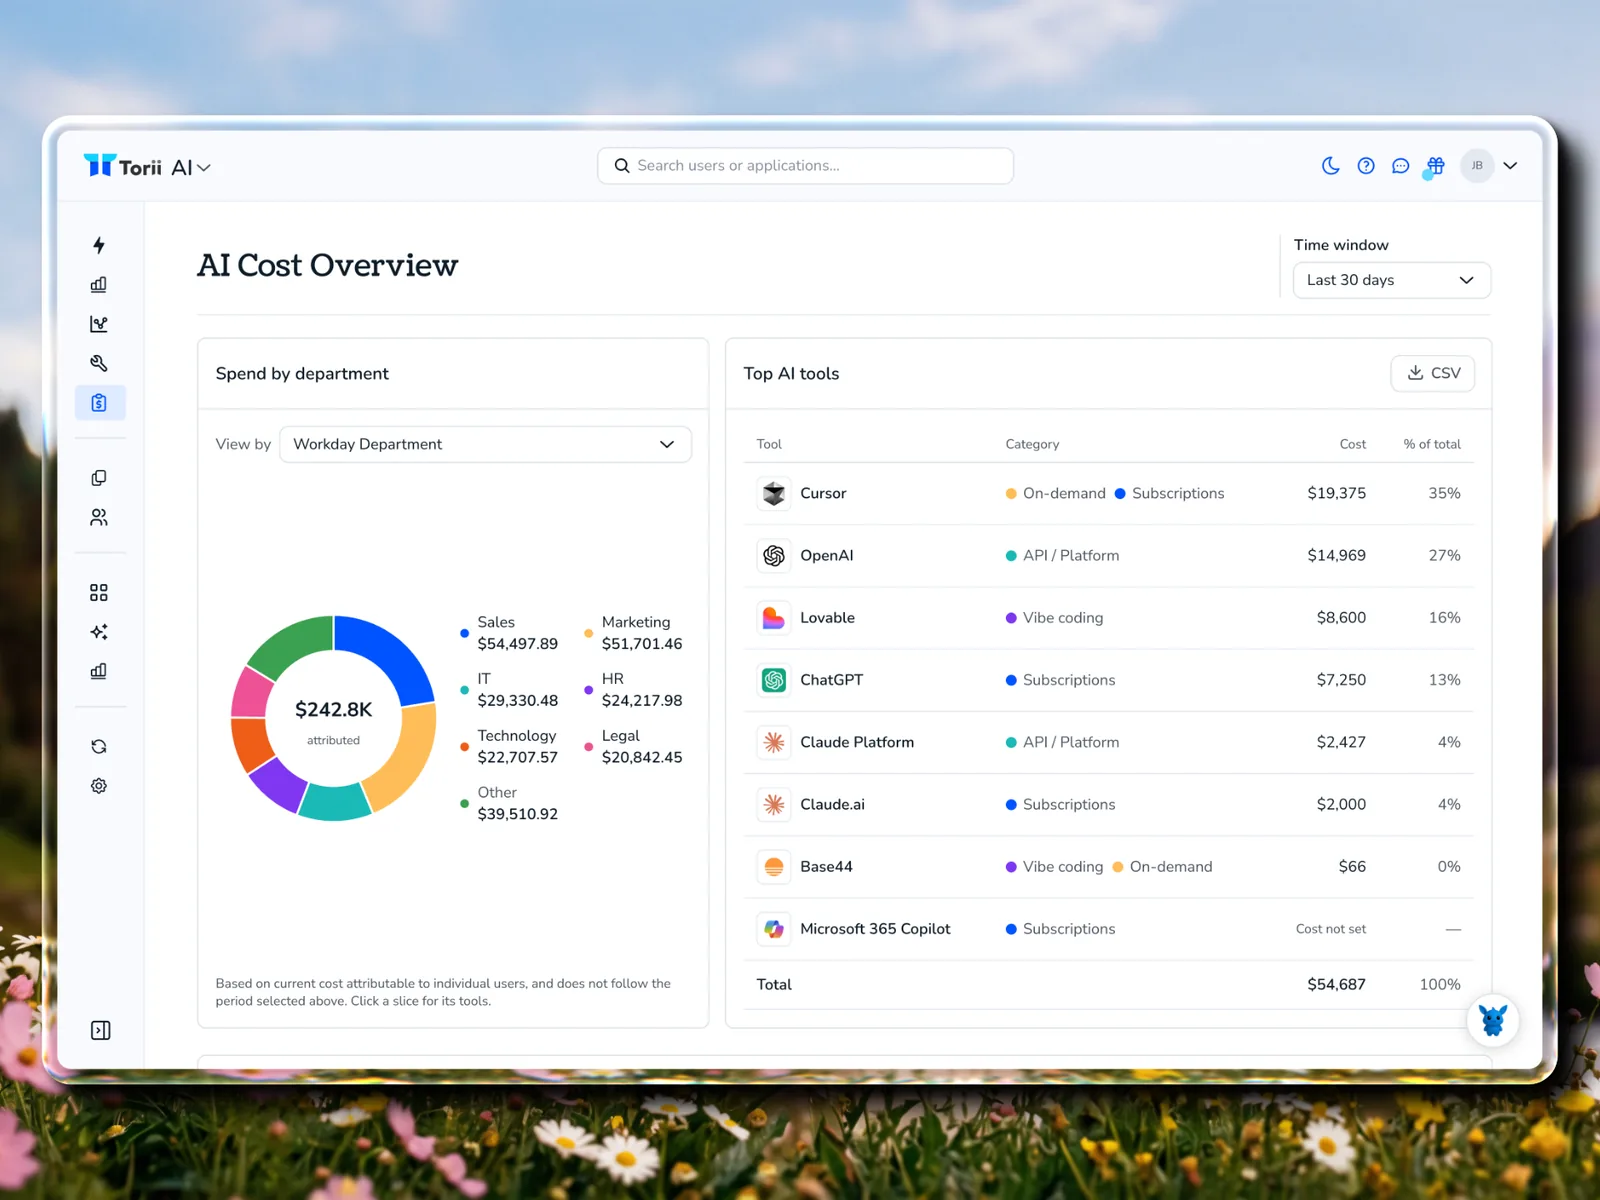
Every team uses AI differently, and Torii’s department breakdown shows exactly how. Pick a team and see its top AI tools, whether each one is billed on demand or by subscription, and where the money goes.
Take a sales team, for example. You might expect a CRM copilot to top their list. Instead, most of their spend is in Cursor, with a sizable Lovable bill right behind it. That’s not a problem to shut down. It’s a signal that reps are building their own tools, and it’s the start of a much better conversation with the sales leader.
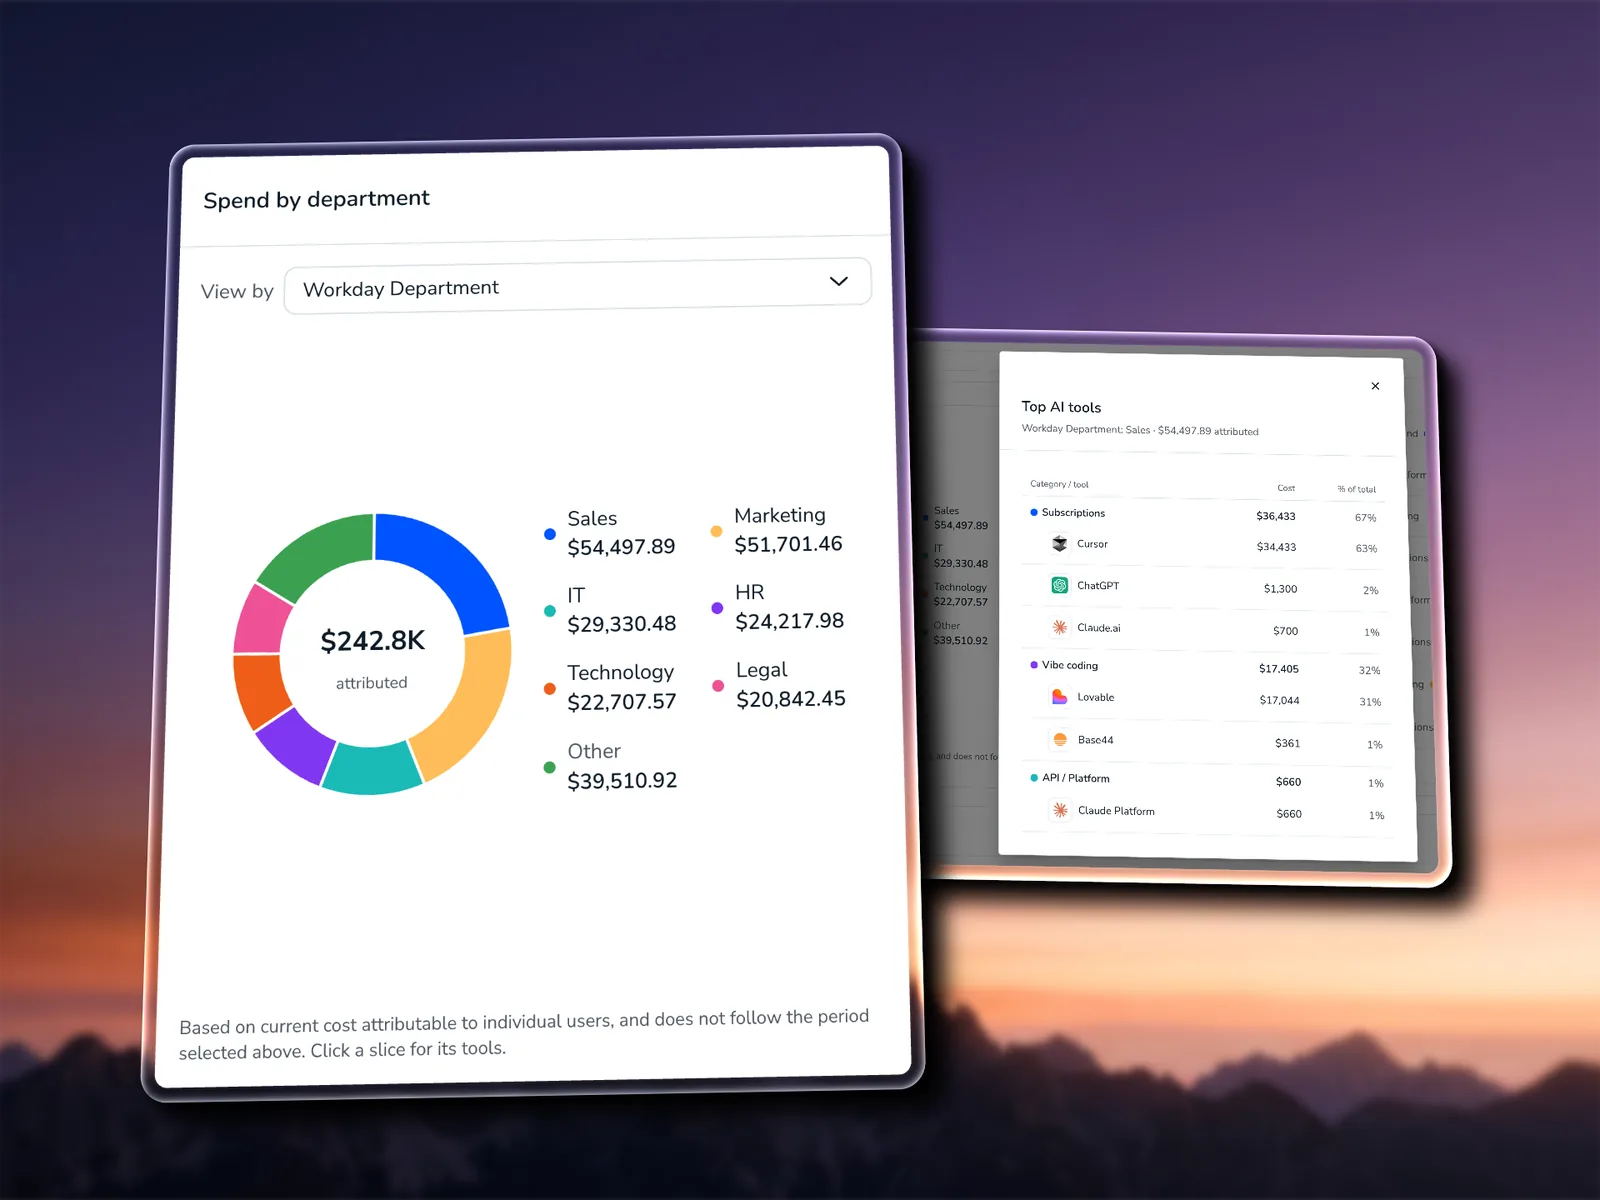
Why it matters: department heads get a clear, specific picture of their AI footprint, and you walk into every budget review with context.
6. Learn what your power users know
Every organization has AI power users. Torii shows you who they are and what they’re actually doing.
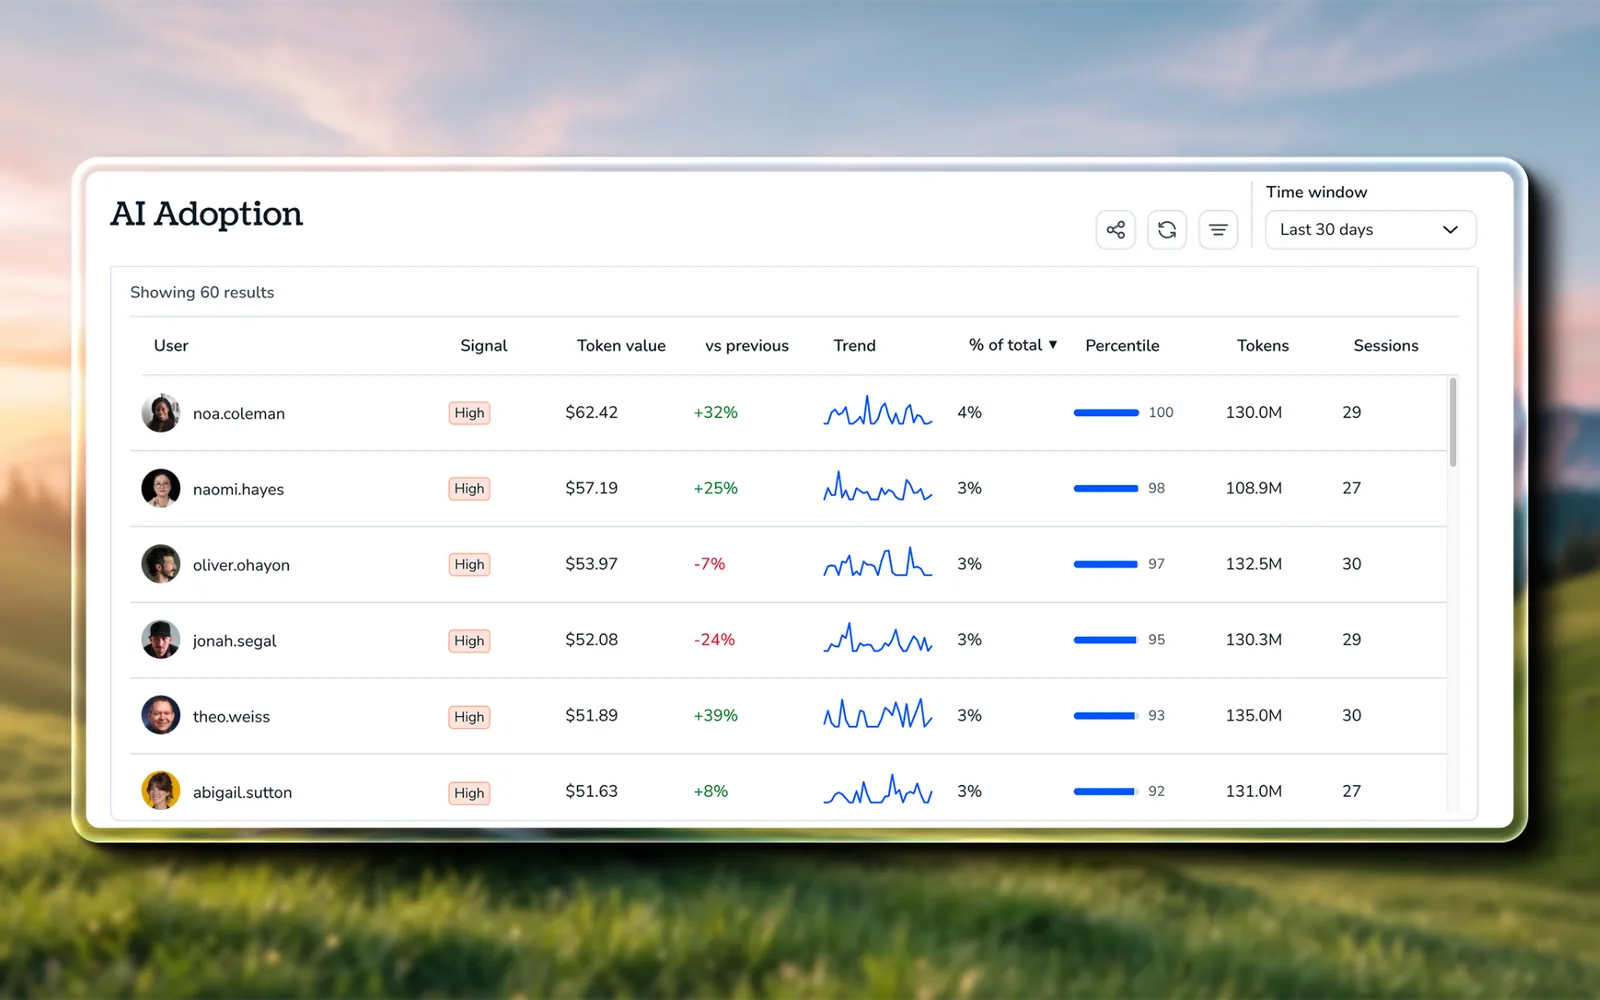
Open any individual’s AI profile and you’ll see:
- Total token value, sessions, requests, and tokens used
- Activity over time
- Their model mix compared to the org average, thanks to the new model heatmap
The heatmap works at the team level too. The Adoption Groups view lays out groups against models, so you can spot which teams lean on premium models and click into any cell to see who’s driving it. Filter by provider, and switch between token share, absolute tokens, and value.
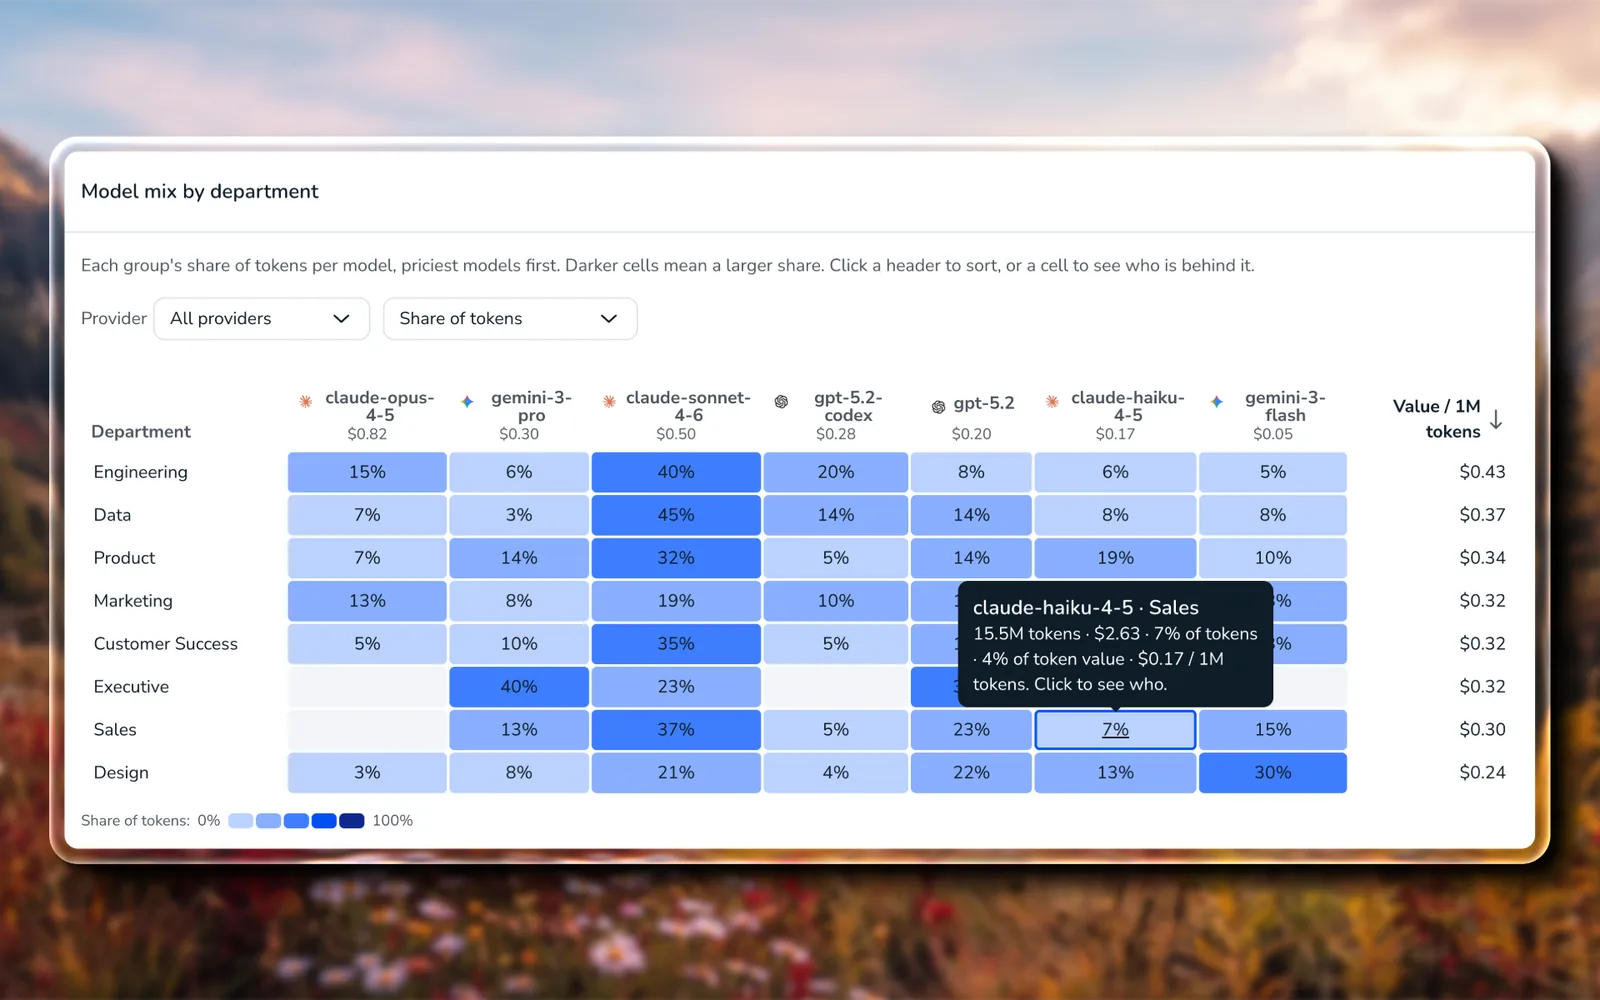
Why it matters: your power users are your best playbook. Find what they do well, then spread it.
7. Get full value out of every AI seat
AI seats are expensive, and an idle one is money on fire. Torii’s subscription efficiency metric shows how much value each person gets from their license. Subscriptions hand out tokens at a different rate than API billing, so this number tells you whether a seat is a great deal or a quiet waste.
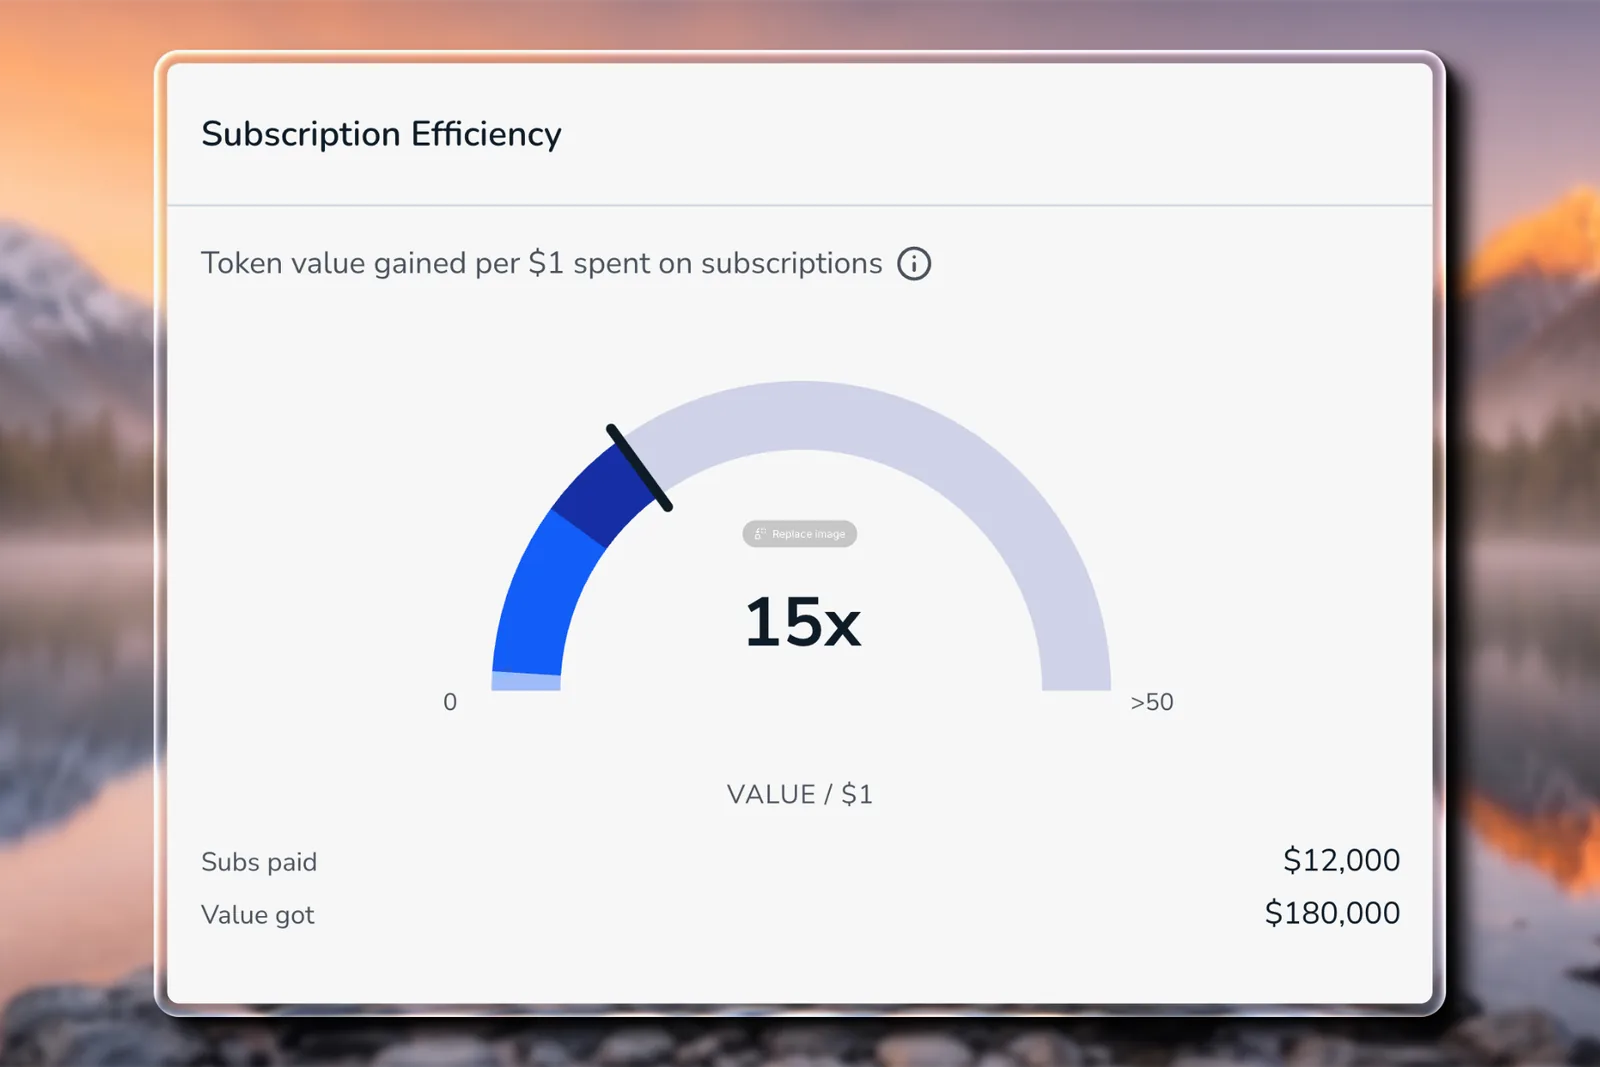
From there, right-sizing gets easy:
- Spot the extremes. Surface inactive licenses, users on the wrong tier, and people ready for an upgrade.
- Catch idle seats early. Developer CLI tracking flags seats with no activity after 30 days. Microsoft 365 Copilot tracking flags seats unused for 90+ days, along with purchased, assigned, and unassigned counts.
- Take action automatically. Revoke, reassign, or notify without a ticket queue. With the new ChatGPT Enterprise integration, Torii workflows can invite, remove, change roles for, and manage group membership of ChatGPT members.
- Keep seat data fresh. Claude.ai Enterprise members, seat tiers, spend limits, and pending invites now sync nightly through Anthropic’s Admin API.
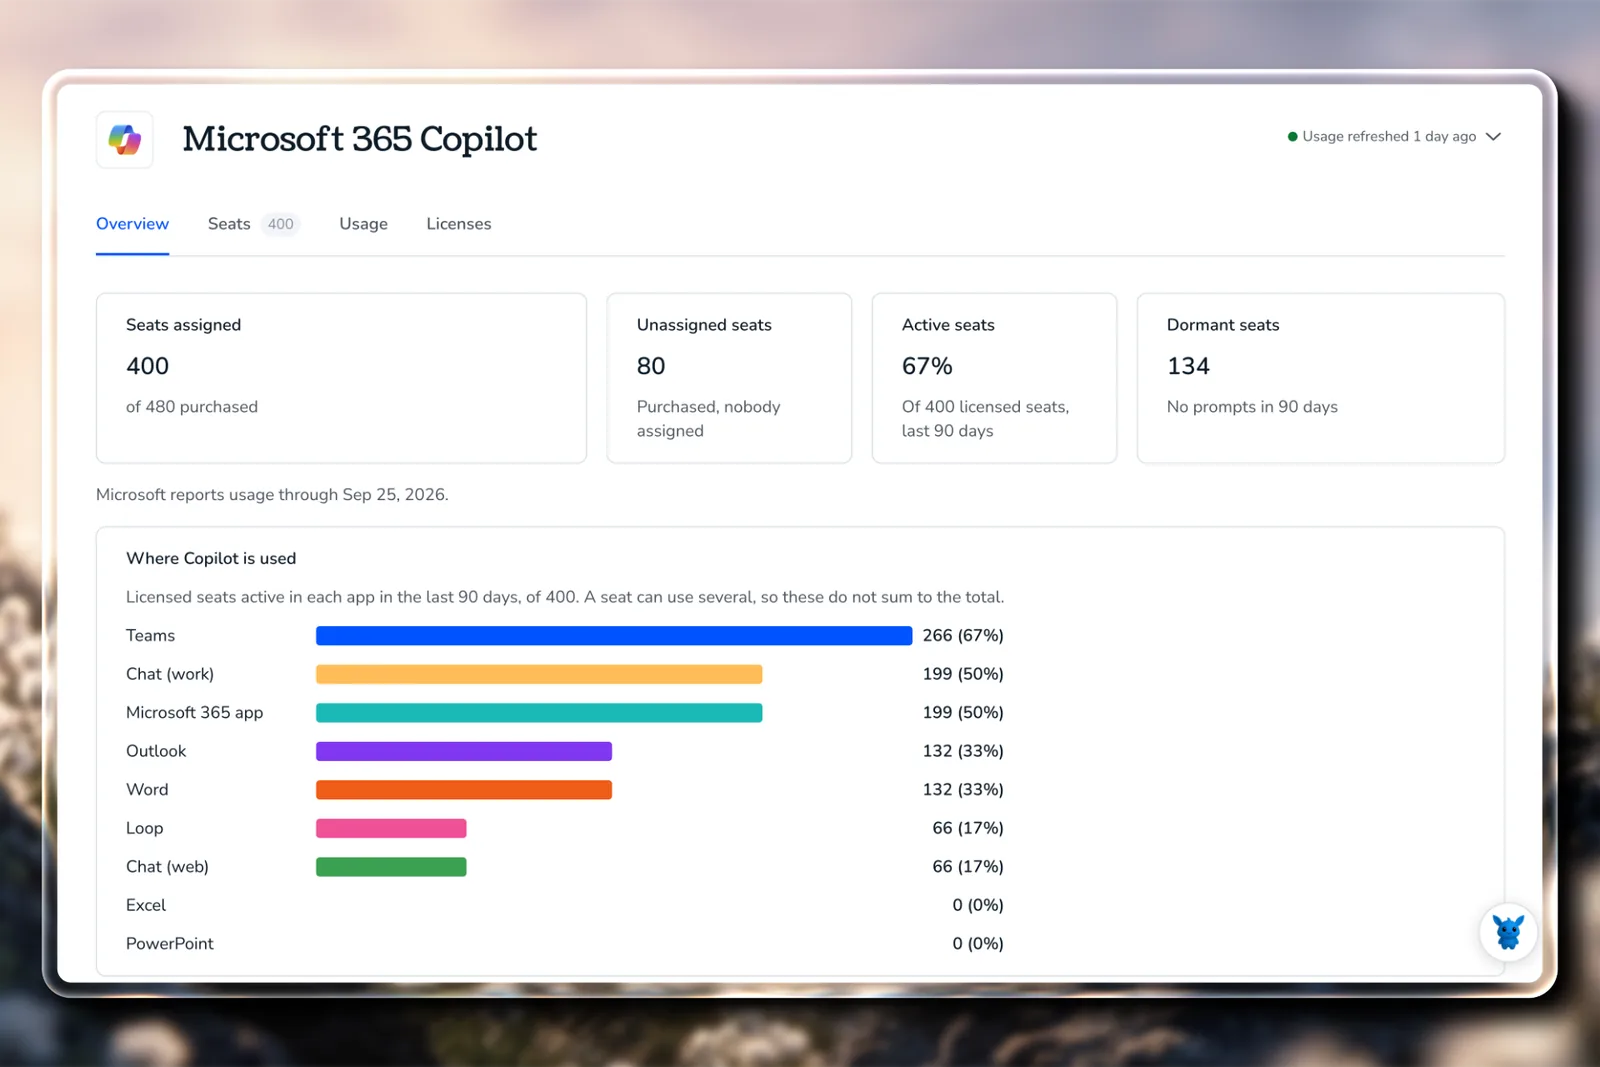
Why it matters: you pay for the AI people use, and the savings show up at renewal.
8. Coach adoption instead of just counting it
AI adoption isn’t a straight line. Some people can’t wait to try every new model. Others hold back, because of their role or just how they approach new tech. Both groups need attention, and the earlier you talk to them, the better.
Torii gives you three views to work from:
- The Usage dashboard shows company-wide token value, active users, sessions, tokens, daily model use, and an auto-generated AI summary.
- The Adoption dashboard breaks adoption down by department or org hierarchy and calls out the biggest movers.
- The AI Pulse dashboard is the live view: active users right now, AI calls per minute, token value rate, and a projection for the day, all over a continuously refreshing window of roughly the last five minutes. It even includes a map of where active users are and a “Model Pulse” that shows which models are busiest.
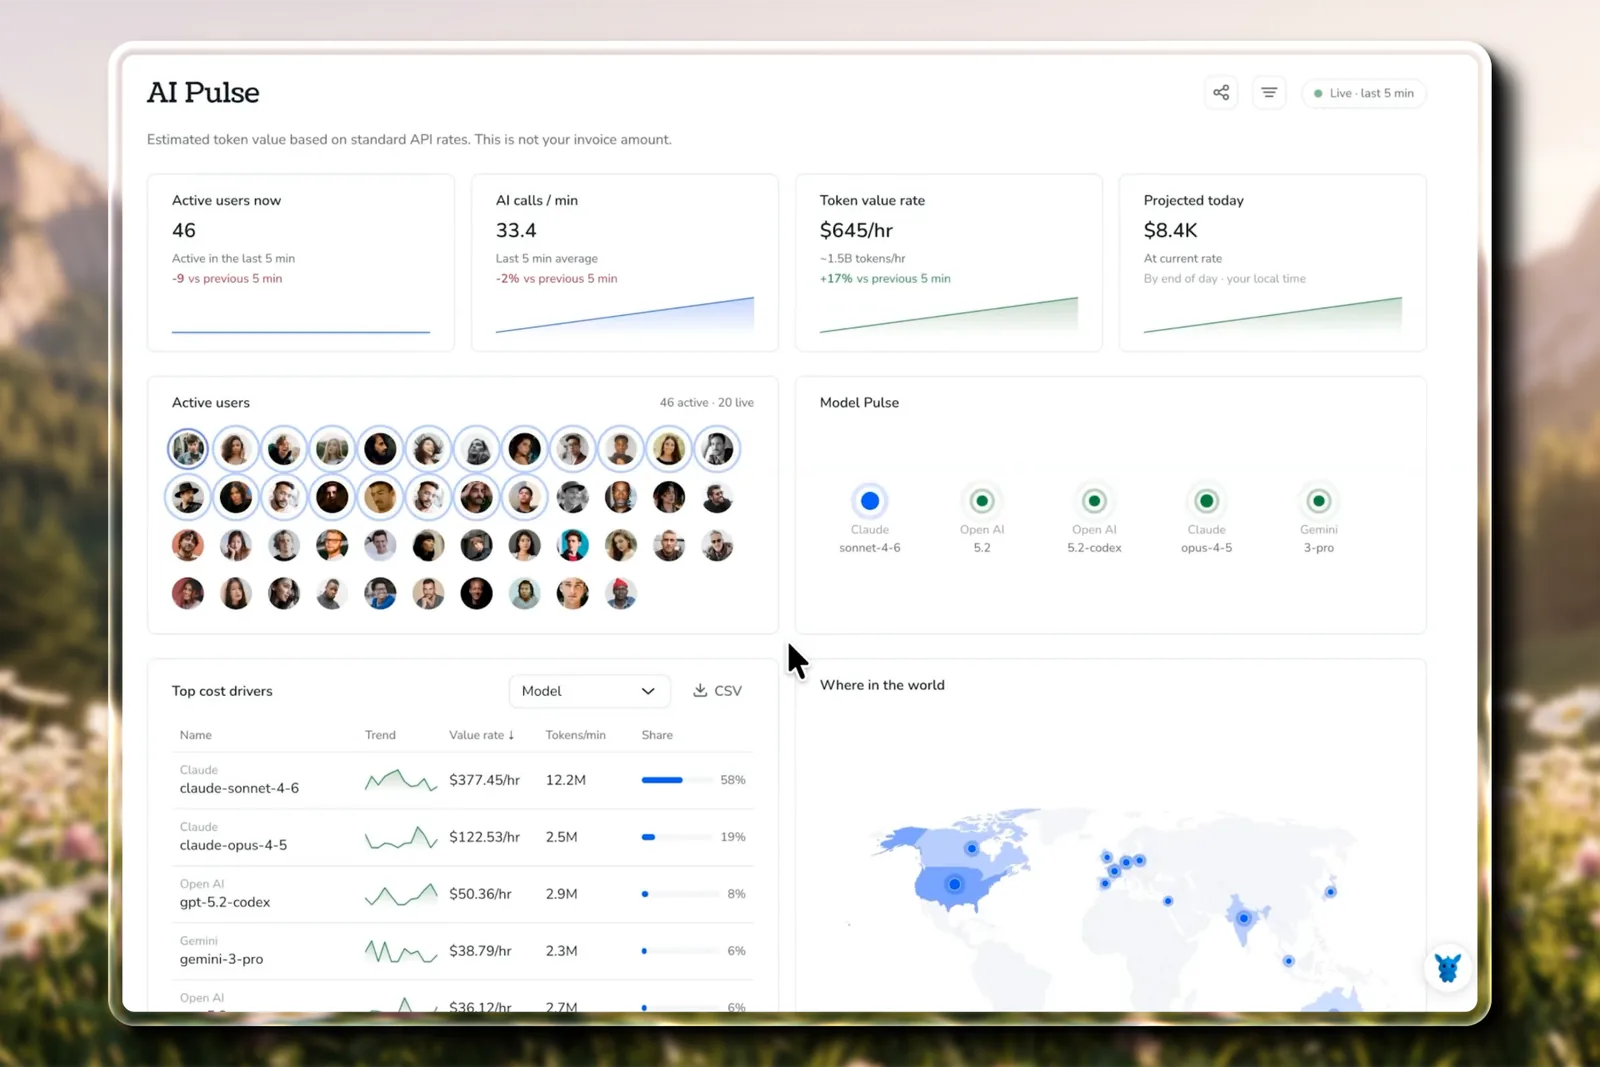
The aggregate view also highlights the people making the most efficient use of their tokens. Those are your champions for the rest of the company.
Why it matters: you can run an AI enablement program on data. Find the champions, find the stragglers, and help both.
Part 3: Go deeper where AI moves fastest
9. Bring engineering’s AI coding agents into view
Some of your heaviest AI usage never shows up in a browser. It runs in the terminal. Torii tracks LLM token usage from developer CLIs, including Claude Code, Gemini CLI, Codex CLI, and GitHub Copilot Chat in VS Code, across macOS, Linux, and Windows.
For each session, Torii captures the user, the model, input and output tokens, and errors. For Claude Code, it also records which tools and MCP servers ran, so security can see what agents are actually doing. The Productivity dashboard adds engineering signals like commits and code changes.
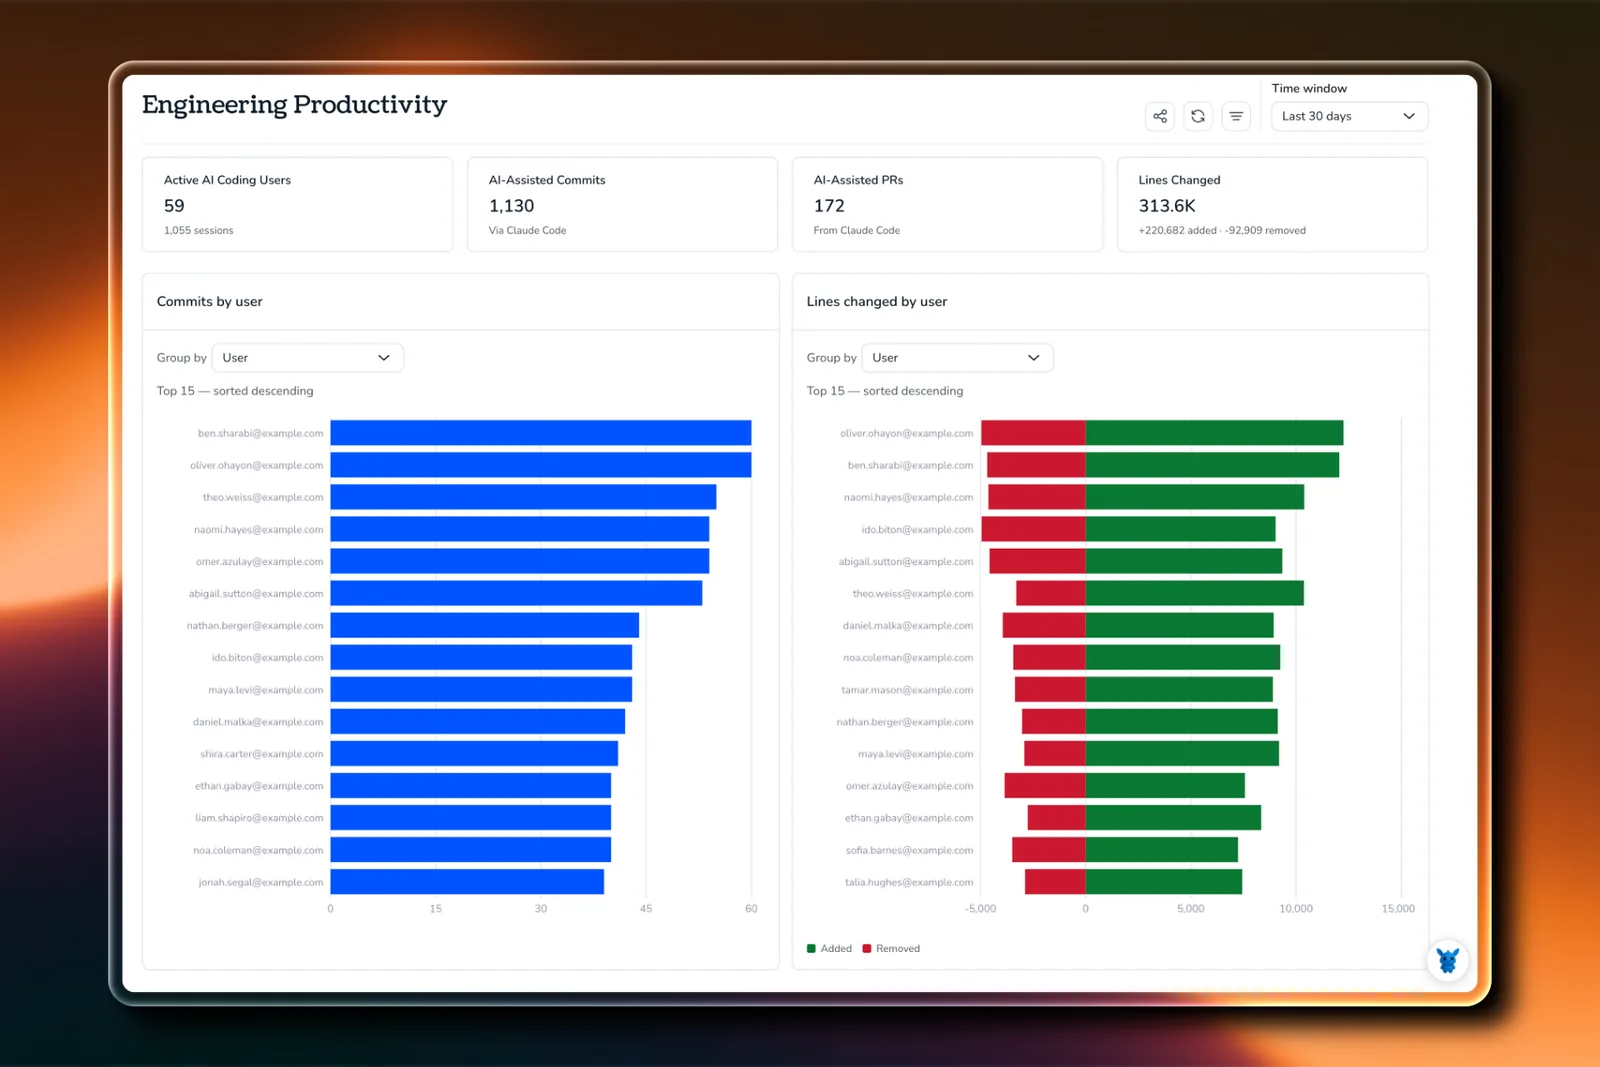
And it’s built to earn developer trust. Prompt contents are off by default, model responses are never captured, and there’s no keystroke logging, screen capture, or shell history collection. Roll it out however suits your team: through MDM (Jamf, Kandji, Intune, JumpCloud, and more), through an existing OpenTelemetry collector, or with a one-liner install for a quick pilot.
Why it matters: engineering AI spend gets the same attribution and governance as everything else, without slowing anyone down.
10. Go deep on any single AI vendor
Sometimes you need to zoom all the way in. Open any AI application in Torii and get the full picture for that vendor.
Open OpenAI, for example, and you’ll see how many members you have, projects ranked by spend, your daily spend rate, the last 30 days of spend, and recent billing history. Claude Platform costs break down by model and workspace. Microsoft 365 Copilot shows prompts and active days over 7, 28, 90, and 180 days, plus usage across Teams, Outlook, and the rest of Office.
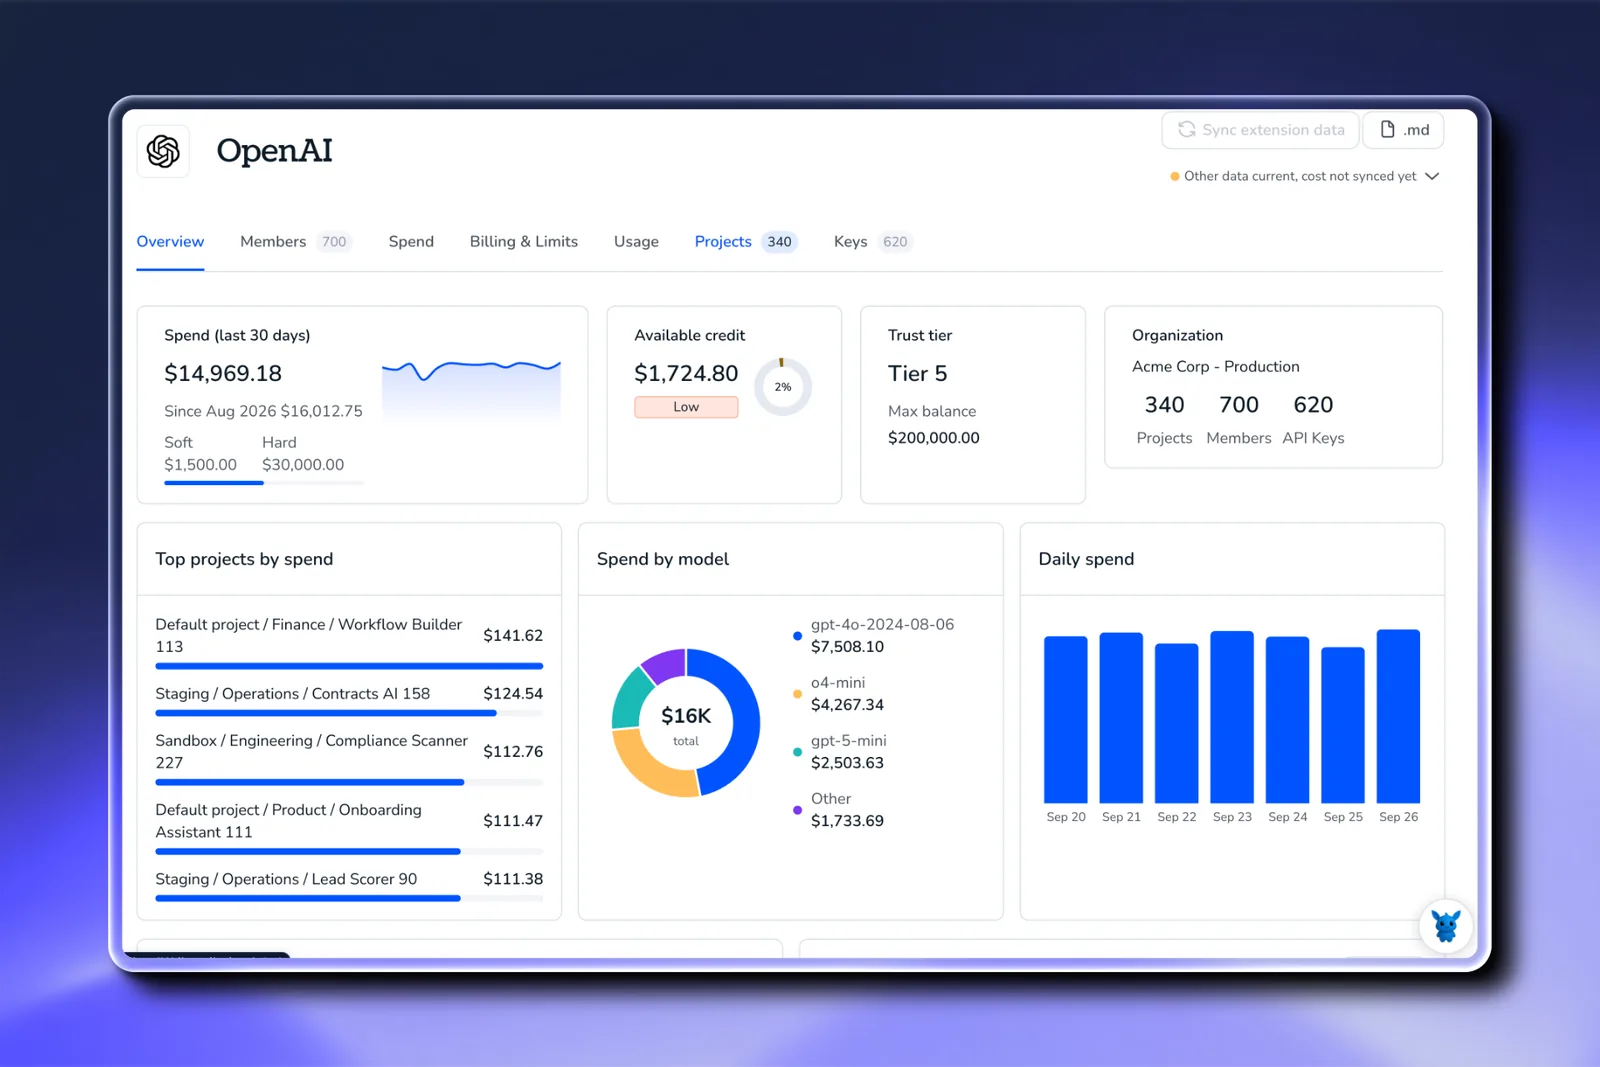
Torii also keeps the data honest. If an AI source stops collecting, it shows a Failed status so you can fix the gap fast. If a custom OpenAI key expires or hits a rate limit, AI Settings tells you exactly what went wrong.
Why it matters: vendor reviews and renewals come with real usage behind them, not a sales rep’s slide.
11. Bring vibe coding out of the shadows
This is where things get exciting. Vibe coding gave non-engineers a superpower: anyone can build a working app in an afternoon. Until now, most organizations had no idea what those apps were, who used them, or what they connected to.
Torii changes that. For platforms like Lovable, you can see your credits, your spend, and a breakdown of your published apps. Then it goes a level deeper. The Integrations tab maps every internal app to the systems it connects to. One app might touch GitHub, Gong, and Segment. Another might reach into AWS, Gong, and Slack. Flip the view around to see every internal app connected to a single system, like GitHub.
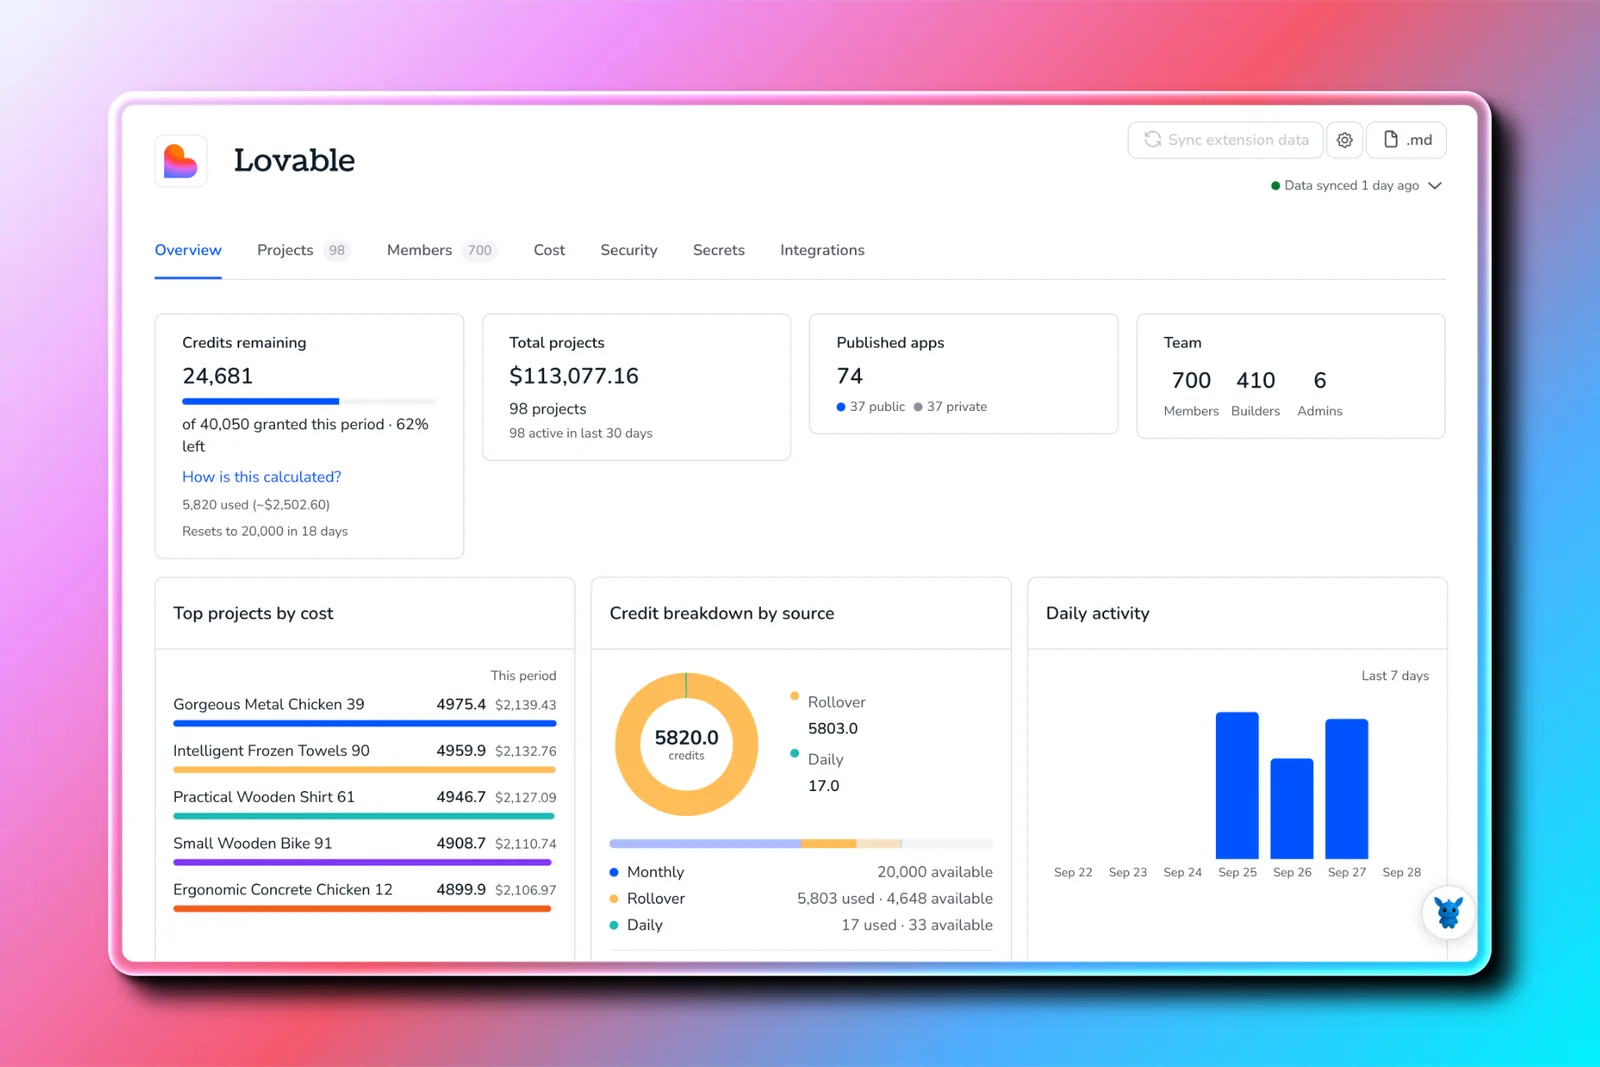
Connect Lovable or Base44 to Torii and each internal app becomes a regular Torii app. You see who has access and how many users it has, user lists stay in sync automatically, and the apps flow into your existing offboarding, access reviews, and reports.
Why it matters: security knows exactly where to start, IT can set policy it can measure against, and your builders keep building.
One platform, every AI question answered
Those 11 use cases add up to one shift: AI goes from something that happens to your company to something you actively run. IT gets the inventory. Finance gets numbers that match the invoice. Security gets a map. And leadership finally gets a straight answer to “is this AI spend worth it?”
Bonus: you don’t even need to open a dashboard to get answers. The Torii MCP Server is now an official connector in Claude’s connector directory, so you can bring Torii data right into your AI conversations.
Ready to see your whole AI footprint in one place? Book a demo and find out what’s really running in your company.