How to Eliminate Overlapping SaaS Tools (Without Hurting Productivity) in 2026

SaaS sprawl creeps up on finance and IT teams until every renewal lands without warning. Soon budgets leak, security gaps widen, and employees juggle overlapping tools that should make work simpler. Regaining control starts with seeing what the company is paying for, then proving who uses it.
For that reason, teams are ditching manual spreadsheet chases in favor of automated SaaS oversight. By combining network discovery, usage analytics, and direct feedback, they compare costs with real business value. Armed with that data, redundant apps are dropped, idle licenses pulled back, and vendor talks begin from a stronger position. The result isn’t just lower spend; it’s a slimmer stack employees are happy to use.
The six-step playbook below lays out how to audit, analyze, and trim SaaS so you save money without slowing anyone down.
Table of Contents
- Conduct a SaaS inventory audit
- Measure real usage and spend
- Categorize and score overlap
- Collect stakeholder feedback
- Execute application rationalization
- Enforce ongoing governance
- Conclusion
- Audit your company's SaaS usage today
Conduct a SaaS inventory audit
Maintaining an accurate SaaS inventory is the foundation of effective cost-cutting. Skip the guesswork; track every paid seat, free trial, and orphaned account draining the budget. Point a network discovery platform like Netskope at outbound traffic. Such platforms sweep company domains, flag rogue sign-ups, and tag each app with the user’s email. Pull SSO logs next. Exports from Azure AD and Okta expose logins that never hit the corporate card, while finance downloads CSVs from NetSuite or Ramp to capture charges on invoices and expense reports.
With data in motion, send each feed to a shared worksheet or data lake and keep the columns lean. You’ll want the basics first, then details that speed later decisions:
- Vendor name and parent company
- Application owner or cost center
- Contract tier, renewal date, and notice window
- Total licenses, seats assigned, and payment model
- Security flags like SOC 2 or HIPAA status
Duplicate entries lurk everywhere, created by typos, mergers, or vanity domains. Run a quick normalization script or even a VLOOKUP so Slack Technologies and slack.com land on one line. Gartner estimates unmanaged SaaS waste at roughly 25 percent of subscription spend, and dirty data is why teams miss it. Once names align, merge rows, keep the freshest metadata, and lock the sheet. Your future self will be grateful when dashboards stop inflating counts.
A living inventory needs a caretaker, so define roles early. Weekly refresh jobs pull new SSO events; monthly finance syncs catch late invoices. Add two data-quality checkpoints: one automated rule that blocks empty renewal dates and one human review that matches high-dollar apps to contracts. The cadence is light yet effective, and it keeps stakeholders honest. When cleanup starts, every department sees the same list, speaks the same numbers, and avoids hours of debate over which spreadsheet is current.

Measure real usage and spend
Start by finding out who really signs in each month; the numbers matter more than hunches when you’re trimming SaaS costs. After the inventory is locked, aim collection scripts at each vendor’s admin console or API to pull raw activity logs. SSO event feeds cover tools without open endpoints, and lightweight browser extensions pick up fringe apps that sit outside corporate authentication.
Once the usage data arrives, tie every log entry to a unique employee ID and license SKU. Most tier-one vendors already return last-login and feature flags, yet batch scripts against CSV exports still work for niche tools. Whatever method you choose, produce a clean monthly active user field that the team can trust.
Blend the activity table with AP finance records to connect actions to dollars.
- Zombie licenses: paid seats with zero logins in 90 days.
- Under-tiered plans: features paid for but never used, flagging downgrades.
- Shadow renewals: auto-charges that processed without owner approval.
Set a rule: any license with a monthly active rate below thirty percent goes under review. Gartner estimates that roughly twenty-five percent of SaaS outlay sits idle, so even cautious thresholds bring real savings.
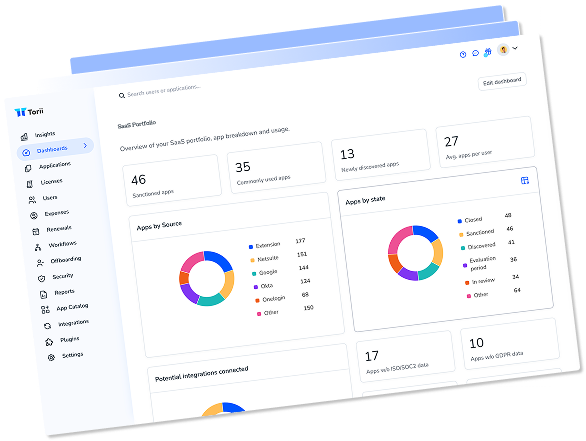
Finance teams prefer visuals to spreadsheets, so load the merged data into a BI tool such as Looker. Heat maps stacking cost per active user against department engagement reveal runaway spend in seconds. A white-space bubble for EMEA sales, for example, quickly becomes the first optimization pilot.
Detailed tracking introduces privacy concerns, especially in regions covered by GDPR. Hash personal identifiers at the connector layer, keep only usage counts, and lock role permissions so managers view nothing beyond their teams. Once security is in place, the ledger updates weekly and feeds every other step in the rationalization workflow without any manual exports.

Categorize and score overlap
Once spend and adoption numbers hit your dashboard, overlapping functionality becomes obvious. Organize each tool into a basic function group such as communication, project work, analytics, code delivery, or back-office tasks. A shared spreadsheet works, though tagging apps inside your SaaS management platform keeps everyone in sync in real time.
With functions tagged, build a comparison matrix that lines apps up side by side. Pull details from product pages for feature lists, note platforms already linked through existing integrations, and record security badges such as SOC 2 Type II or ISO 27001. A quick scan often explains why teams fund both Slack and Microsoft Teams even though a 2023 BetterCloud study shows the pair overlap across 70 percent of daily collaboration work. The same matrix also reveals when a niche tool, like Loom, fills a gap no suite covers.
A weighted scoring model converts that qualitative grid into an actionable score. The weights typically favor user adoption and cost considerations over minor feature extras that seldom influence daily work:
- Adoption rate (active seats divided by licensed seats)
- Cost efficiency (annual spend per active user)
- Functional depth (essential features weighted high, nice-to-haves weighted low)
- Strategic value (roadmap fit, compliance posture, vendor stability)
Define each weight before you crunch the numbers, then let formulas rank tools within each cluster. A run of low scores in one column usually signals a redundant app ready for retirement.
Heat maps translate the rankings into a snapshot that busy executives can absorb fast. Coloring spend in red, yellow, and green shows where three or more tools chase the same job, such as file sharing or digital whiteboards. Eliminating one red square across regions can unlock six-figure savings.
Stay alert to situations where a blanket decision would hurt a critical workflow. If the design team needs Figma’s advanced prototyping while the rest of the company thrives in Google Slides, record that exception in the model and mark its licenses as protected. Rationalization pays off only when productivity remains intact.

Collect stakeholder feedback
Data means nothing if the people using the tools disagree with the numbers.
The quickest way to capture their take is through the channels they already check each morning. Drop one-click pulse surveys in Slack or Microsoft Teams and you’ll usually top a 70 percent response rate because nobody leaves their workspace. Time the bot to tap users right after they work inside an app, not at random, so answers stay linked to real workflows. If a tool lacks a chat plug-in, park an NPS-style micro-poll in the product banner; thirty seconds of friction still beats a ten-question email form. One rule: cap any survey at three focused questions or people bail.
Questions must tie back to the rationalization goals, not broad satisfaction scores. Ask which feature the team touches daily, what breaks when the tool disappears, and which alternative already sits on their desktop. To keep analysis tidy, force structured answers and leave open text only for comments. A practical template:
- Rate how critical the tool is to completing your core tasks.
- Select the one feature you cannot replace elsewhere.
- Choose the team-wide alternative you would use if this app vanished tomorrow.
- Comment on integration gaps or data-loss concerns.
After collecting the data, the next step is to convert it into a change-risk score. Weight criticality against adoption depth. Feed these numbers into the overlap chart to protect edge cases that usage logs miss. For live discussion, host a 30-minute role-based workshop and pressure-test the findings; product managers often surface undocumented integrations that can blow up a migration plan if ignored.
Good governance stops the program from drifting into survey fatigue. Rotate the respondent pool quarterly so no one answers more than twice a year, and always share a one-page “You said, we did” recap to close the loop. Store feedback and scores in the SaaS inventory system so future audits start with context, not a blank slate.

Execute application rationalization
Plans on paper save money only when the rollout follows a sensible order. Map a RACI chart that tags every license change, contract signature, and cut-over test to a named owner, approver, contributor, and informed party. Renewal clocks don’t pause, so anchor that chart to a calendar that lists each vendor’s notice period and avoids accidental auto-renewals when someone in procurement is out.
Bring data to every vendor call and ask for one of three concessions: fewer seats, a lower price per seat, or cleaner terms. Usage reports, competitive benchmarks, and switching costs give you a three-sided argument that steers the talk away from list price. Presenting all three figures at once often drives double-digit savings, so build the story before you dial.
With contracts lined up, write an exit playbook that retires each outgoing tool without breaking a workflow. Treat it like a mini-project, not a Friday afternoon chore:
- Archive or export all user data in a format the surviving platform can easily import.
- Freeze new account creation two weeks before shutoff so nothing gets stranded.
- Deliver a one-page job aid that shows users where familiar buttons have moved.
- Schedule a rollback window and keep admin credentials active until the new system passes acceptance tests.
Consistent, plain-spoken communication keeps every part of the migration moving in the same direction. Open with a note that spells out what is changing, why it matters, and when it happens, then send reminders at key stages: contract signed, pilot live, cut-over day, last access day. Stagger messages by region so Asia-Pacific teams wake up to instructions, Europe sees them midday, and North America gets them before lunch. A brief recorded demo beats a polished slide deck every time, and a shared Slack channel gives users real-time help without sparking reply-all storms.

Enforce ongoing governance
The cost cuts you win this quarter vanish without oversight controls. A SaaS Management Platform (SMP) keeps the savings from bleeding out again by watching licenses and renewals every day, not just at audit time. Pick a tool that connects to your single sign-on, accounting system, and support tickets so setup takes hours, not months. Leading platforms spot unused seats during the first sync, giving you proof of value before the next finance meeting.
Connecting the SMP to HRIS is step one because people moves trigger most waste. When an employee leaves, the platform should yank access, reclaim the seat, and open a ticket for data retention in the same motion. Finance integration matters just as much; every new charge hits the dashboard within a day, so shadow renewals get flagged while there is still time to cancel them. Security teams score a win too: SIEM or CASB hooks pull risky app use into one feed matching spend with exposure.
Once the connections are live, set up guardrails to keep spending and risk in check. Write clear policies in plain language, then translate them into the platform’s rule engine. For example, block new purchases that overlap an approved category, or cap trial length at 14 days. The system enforces the rules, not email reminders.
- Auto-provision seats only from the approved catalog
- Freeze unused licenses after 30 days of inactivity
- Route any purchase above a set amount to procurement for a quick check
Even small companies see license counts drop 15 percent in the first quarter with these switches flipped.
The dashboards only earn attention when they tell a story people can act on. Track cost per employee, active license ratio, and time to deprovision on one page, then review the numbers with budget owners every 90 days. Patterns jump out fast: a rising active ratio means adoption is healthy, while flat spend and headcount suggest price creep hiding in plan upgrades.
To keep the system honest, schedule a light maintenance window once a month. The SMP pulls new contracts, you skim the exceptions list, and stakeholders approve fixes in minutes. Governance stays alive, the app stack stays lean, and no one hunts through spreadsheets again.

Conclusion
Cutting SaaS waste takes more than guesswork; it demands a process grounded in reliable data. Start with an automatically generated inventory, add usage counts, then compare tools by task to spot functional overlap and eliminate redundant costs. Stakeholder surveys supply context so essential work remains covered, while a transparent framework steers discussions, migrations, and retirements. Finally, a SaaS management platform enforces the rules and flags new risk before the bill climbs again.
Follow these six steps from start to finish and you will trim SaaS costs, clear out waste, and protect productivity for the long haul.

Audit your company’s SaaS usage today
If you’re interested in learning more about SaaS Management, let us know. Torii’s SaaS Management Platform can help you:
- Find hidden apps: Use AI to scan your entire company for unauthorized apps. Happens in real-time and is constantly running in the background.
- Cut costs: Save money by removing unused licenses and duplicate tools.
- Implement IT automation: Automate your IT tasks to save time and reduce errors - like offboarding and onboarding automation.
- Get contract renewal alerts: Ensure you don’t miss important contract renewals.
Torii is the industry’s first all-in-one SaaS Management Platform, providing a single source of truth across Finance, IT, and Security.
Learn more by visiting Torii.
Frequently Asked Questions
Start by auto-discovering every app via SSO and finance feeds, normalize the inventory, pull usage logs, tag tools by function, survey users, rank overlap, then cancel, downgrade or renegotiate—following a six-step loop of audit, analyze, score, consult, execute, and govern.
Sprawl happens when employees buy tools on cards, renewals are set to auto-pay, and IT tracks licenses in static spreadsheets. The result is duplicate apps, idle seats, surprise invoices, and security gaps that quietly balloon budgets by roughly 25 %.
Raw sign-in and feature logs reveal which seats sit idle, which tiers go unused, and where overlapping products live. Pairing that data with spend lets teams cut zombie licenses, downgrade plans, and walk into vendor talks armed with proof, not guesses.
Surveys in Slack or Teams capture how critical an app feels to daily work, surface hidden integrations, and flag transition risks. Folding those insights into the overlap scores ensures you retire only redundant tools, preserving productivity and user trust.
Bring monthly active counts, cost-per-user metrics, and competitor benchmarks to renewal meetings. Ask for fewer seats, lower unit pricing, or shorter terms. Concrete data and a clear alternative stack shift leverage from the vendor to your procurement team.
Connect a SaaS Management Platform to SSO, finance, and HRIS, then enforce rules like auto-deprovisioning leavers, freezing inactive seats after 30 days, and routing new purchases for approval. Dashboards reviewed quarterly keep ownership accountable and prevent spend from creeping back.