NEW: Torii was named a Leader in the 2026 Gartner® Magic Quadrant™ for SaaS Management Platforms

Torii Research

SaaS Statistics 2026

694 sourced statistics on SaaS management: sprawl, shadow IT, shadow AI, AI agents, license waste and security. Torii's own discovery data first, then every credible number we could trace to its original source.

Popular:

  • 694 statistics
  • 106 publishers
  • 10 topics
  • 1 source link under every number
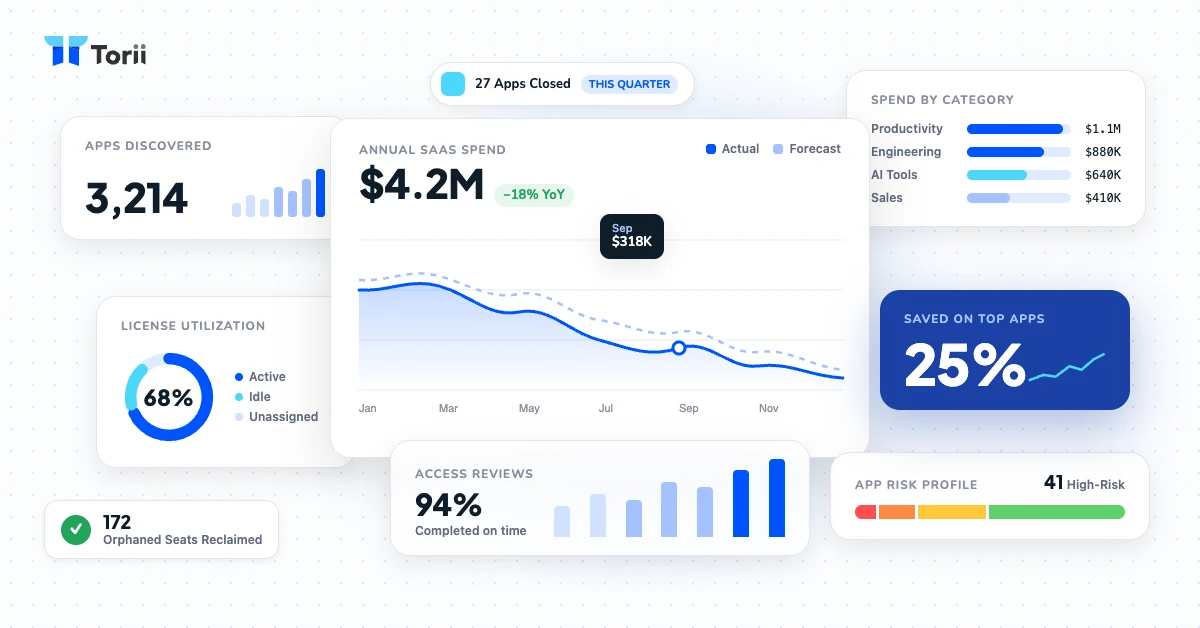
Torii dashboard showing discovered apps, annual SaaS spend, license utilization, access reviews and app risk

Torii research

The SaaS Benchmark Annual Report 2026

The observed data behind every Torii figure on this page: app sprawl by company size, the shadow IT leaderboard, AI adoption and shadow rates, license waste and contract overage.

  • 831apps per organization
  • 61.3%of apps are shadow IT
  • 694new AI apps in 2025
Read the benchmark report

Analyst recognition

Torii is a Leader in the 2026 Gartner® Magic Quadrant™ for SaaS Management Platforms

Gartner evaluated 16 SaaS management platform vendors. Torii has been named a Leader in every edition since the first Magic Quadrant for the category in 2024.

Get the Gartner report

Gartner, Magic Quadrant for SaaS Management Platforms, Tom Cipolla, et al, 18 June 2026.

Sprawl831apps in the average organizationTorii, SaaS Benchmark Annual Report 2026

Key SaaS statistics for 2026

Sprawl · 48 stats

SaaS sprawl statistics

The average organization runs 831 apps, and every one of them lands on someone's screen.

Who's counting?"How many apps does a company use" has five honest answers Each source counts something different. The further right, the more of the stack the method can see.
  1. 101 Oktaapps connected to Okta per customer
  2. 106 BetterCloudSaaS apps IT reports in a survey
  3. 342 Productivapps found by Productiv discovery
  4. 831 Toriiapps found by Torii discovery, shadow IT included
  5. 957 MuleSoftenterprise applications of every kind, not only SaaS
02505007501,000 apps
Torii dataApp count accelerates with headcountAverage apps per organization, by company size. Median in the label underneath.
448Under 100median 392
679100-499median 615
1,189500-1,499median 1,157
1,2501,500-3,999median 1,335
2,1914,000+median 2,323

Source: Torii, SaaS Benchmark Annual Report 2026, "Volume Explosion" chart.

See the full chart in the benchmark report

How many apps a company runs 24 stats

Torii data

831

apps in the average organization

Torii, SaaS Benchmark Annual Report 2026

Observed data · 2026

Method and full statement

The average organization runs 831 SaaS apps, according to Torii's 2026 SaaS Benchmark.

Method
Observed: aggregated, anonymized discovery data from environments Torii connects to
Sample
not published
#
Torii data

2,191

apps at the average 4,000+ employee enterprise

Torii, SaaS Benchmark Annual Report 2026

Observed data · 2026

Method and full statement

Enterprises with 4,000+ employees run 2,191 apps on average (median 2,323), according to Torii's 2026 SaaS Benchmark.

Method
Observed: aggregated, anonymized discovery data from environments Torii connects to
Sample
not published
#
Torii data

40

apps the average employee uses

Torii, SaaS Benchmark Annual Report 2026

Observed data · 2026

Method and full statement

Across all company sizes, the average employee interacts with 40 apps, according to Torii's 2026 SaaS Benchmark.

Method
Observed: aggregated, anonymized discovery data from environments Torii connects to
Sample
not published
#

11%

YoY rise in apps per organization

BetterCloud, 2026 State of SaaS

Survey · n=525 · 2026

Method and full statement

BetterCloud's 2026 State of SaaS report found the average number of apps per organization rose 11% year over year, ending two years of consolidation.

Method
Survey of 525 IT and security professionals at SaaS-first organizations
Sample
n=525
#

957

applications managed by the average enterprise

MuleSoft (Salesforce), 2026 Connectivity Benchmark Report

Survey · n=1,050 IT leaders · 2026

Method and full statement

According to MuleSoft's 2026 Connectivity Benchmark Report, the average organization now manages 957 applications.

Method
Survey of 1,050 IT leaders globally (MuleSoft 2026 Connectivity Benchmark Report)
Sample
n=1,050 IT leaders
#

101

apps deployed by the average company

Okta, Businesses at Work 2025

Observed data · thousands of Okta customers · 2025

Method and full statement

According to Okta's Businesses at Work 2025 report, the average company now deploys 101 apps, crossing 100 for the first time after years of flat growth.

Method
Telemetry: anonymized Okta customer data on apps deployed through the Okta Integration Network (OIN)
Sample
thousands of Okta customers (exact count not stated on page)
#

342

apps in the average SaaS portfolio

Productiv (reported by CIO Dive), State of SaaS 2024

Observed data · nearly 100 million SaaS licenses · 2024

Method and full statement

According to Productiv data reported by CIO Dive, organizations cut their app portfolios 10% in 2023, but the average still stood at 342 apps, down from 374.

Method
Telemetry: Productiv analysis of 100+ billion app usage data points across nearly 100 million SaaS licenses
Sample
nearly 100 million SaaS licenses
#
Show all 24 stats in this section
Torii data

682

apps in the median organization

Torii, SaaS Benchmark Annual Report 2026

Observed data · 2026

Method and full statement

The median organization runs 682 SaaS apps, according to Torii's 2026 SaaS Benchmark.

Method
Observed: aggregated, anonymized discovery data from environments Torii connects to
Sample
not published
#
Torii data

448

apps at the average startup under 100 people

Torii, SaaS Benchmark Annual Report 2026

Observed data · 2026

Method and full statement

Companies under 100 employees run 448 apps on average (median 392), according to Torii's 2026 SaaS Benchmark.

Method
Observed: aggregated, anonymized discovery data from environments Torii connects to
Sample
not published
#

41%

one-year jump in mid-market app count (116 to 164)

BetterCloud, 2026 State of SaaS

Survey · n=525 · 2026

Method and full statement

Mid-market organizations saw their average app count jump 41% in a single year, from 116 to 164, according to BetterCloud.

Method
Survey of 525 IT and security professionals at SaaS-first organizations
Sample
n=525
#

27%

of enterprise apps are connected

MuleSoft (Salesforce), 2026 Connectivity Benchmark Report

Survey · n=1,050 IT leaders · 2026

Method and full statement

Only 27% of an organization's applications are connected to each other on average, according to MuleSoft's 2026 Connectivity Benchmark Report.

Method
Survey of 1,050 IT leaders globally (MuleSoft 2026 Connectivity Benchmark Report)
Sample
n=1,050 IT leaders
#

114

apps per US company, up 9% YoY

Okta, Businesses at Work 2025 (infographic)

Observed data · Okta global customer base · 2025

Method and full statement

Okta's Businesses at Work 2025 data shows US companies deploy an average of 114 apps, up 9% year over year, the highest of any country Okta reports.

Method
Telemetry: anonymized Okta customer data on apps deployed through the Okta Integration Network (OIN)
Sample
Okta global customer base
#

74

apps per organization in EMEA

Okta, Businesses at Work 2025 (infographic)

Observed data · Okta global customer base · 2025

Method and full statement

According to Okta, the average EMEA organization deploys 74 apps, up from 69 a year earlier, while the global average reached 101.

Method
Telemetry: anonymized Okta customer data on apps deployed through the Okta Integration Network (OIN)
Sample
Okta global customer base
#

60%

of the most popular apps are security or collaboration

Okta, Businesses at Work 2025

Observed data · thousands of Okta customers · 2025

Method and full statement

Security and collaboration apps together make up 60% of the most widely deployed apps, according to Okta's Businesses at Work 2025.

Method
Telemetry: anonymized Okta customer data on apps deployed through the Okta Integration Network (OIN)
Sample
thousands of Okta customers
#

106

SaaS apps per company (2025 survey)

BetterCloud, 2025 State of SaaS

Survey · n≈600 · 2025

Method and full statement

BetterCloud's 2025 State of SaaS report found companies used an average of 106 SaaS apps, down from 112 the year before.

Method
Survey of about 600 IT professionals
Sample
n≈600
#

897

applications used by the average organization (2025)

MuleSoft (Salesforce), 2025 Connectivity Benchmark Report

Survey · n=1,050 IT leaders · 2025

Method and full statement

According to MuleSoft's 2025 Connectivity Benchmark Report, organizations use 897 applications on average.

Method
Survey of 1,050 IT leaders, run with Vanson Bourne and Deloitte Digital
Sample
n=1,050 IT leaders
#

23%

one-year jump in tools per company

Spendflo, State of SaaS Procurement 2025

Vendor or analysis · 2025

Method and full statement

The average tool count per company jumped 23% in a year, driven by AI-powered tools, according to Spendflo's State of SaaS Procurement 2025 report.

Method
method not stated (described as finance-leader insights plus Spendflo contract data)
Sample
not stated
#

93

apps per company in 2023, up 4%

Okta, Businesses at Work 2024

Observed data · 18,800+ customers · 2024

Method and full statement

Okta's 2024 Businesses at Work report found the average company's app count grew 4% to 93, after stalling at 89 for two years.

Method
Telemetry: aggregated, anonymized data from Okta's 18,800+ global customers and the Okta Integration Network (7,000+ integrations); data Nov 1, 2022 to Oct 31, 2023
Sample
18,800+ customers
#

231

apps at companies with 2,000+ employees

Okta, Businesses at Work 2024

Observed data · 18,800+ customers · 2024

Method and full statement

According to Okta, large companies with 2,000 or more employees deploy an average of 231 apps each, up 10% from 211 a year earlier.

Method
Telemetry: aggregated, anonymized data from Okta's 18,800+ global customers and the Okta Integration Network (7,000+ integrations); data Nov 1, 2022 to Oct 31, 2023
Sample
18,800+ customers
#

72

apps at companies under 2,000 employees

Okta, Businesses at Work 2024

Observed data · 18,800+ customers · 2024

Method and full statement

Okta's data shows companies with fewer than 2,000 employees deploy an average of 72 apps, up from 69 a year earlier.

Method
Telemetry: aggregated, anonymized data from Okta's 18,800+ global customers and the Okta Integration Network (7,000+ integrations); data Nov 1, 2022 to Oct 31, 2023
Sample
18,800+ customers
#

47

apps per tech startup, up 15%

Okta, Businesses at Work 2024

Observed data · 18,800+ customers · 2024

Method and full statement

Tech startups (100 or fewer employees) grew their app count 15% in a year to an average of 47 apps, according to Okta.

Method
Telemetry: aggregated, anonymized data from Okta's 18,800+ global customers and the Okta Integration Network (7,000+ integrations); data Nov 1, 2022 to Oct 31, 2023; 'tech startups' = technology-sector companies with 100 or fewer employees
Sample
18,800+ customers
#

105 vs 66

apps per company, US vs Canada

Okta, Businesses at Work 2024

Observed data · 18,800+ customers · 2024

Method and full statement

Okta found US companies deploy an average of 105 apps, while Canadian companies deploy just 66.

Method
Telemetry: aggregated, anonymized data from Okta's 18,800+ global customers and the Okta Integration Network (7,000+ integrations); data Nov 1, 2022 to Oct 31, 2023
Sample
18,800+ customers
#

58

apps per SMB (36 for small businesses)

Okta, SMBs at Work 2024

Observed data · Okta SMB customers · 2024

Method and full statement

According to Okta's SMBs at Work 2024 report, SMBs (500 or fewer employees) deploy an average of 58 apps and small businesses (50 or fewer) about 36.

Method
Telemetry: anonymized Okta customer data; SMB = 500 or fewer employees, small business = 50 or fewer
Sample
Okta SMB customers
#

130

peak apps per company in 2022

BetterCloud, State of SaaSOps 2024

Survey · 2024

Method and full statement

According to BetterCloud, the average company's SaaS app count peaked at 130 in 2022, then fell 14% to 112 in 2023, the first decline in over a decade.

Method
Annual survey of IT professionals (sample size not stated in release)
Sample
not stated
#

Every app lands on someone's screen 14 stats

~7 hrs

lost per employee each week to fragmented tools

Freshworks, The Cost of Complexity Report

Survey · n=706 · 2025

Method and full statement

Employees lose nearly seven hours a week, almost a full workday, to complicated processes and fragmented tools, according to Freshworks.

Method
Survey of 706 practitioners and decision-makers in IT, CX, finance and operations across the US, UK, India, France, Germany and Australia, plus 25 qualitative interviews
Sample
n=706
#

1,200

app and window toggles per worker per day

Harvard Business Review, How Much Time and Energy Do We Waste Toggling Between Applications? (Murty, Dadlani, Das)

Observed data · 137 users, 20 teams, 3 Fortune 500 companies · 2022

Method and full statement

Workers toggle between apps and websites roughly 1,200 times a day, losing just under four hours a week (about 9% of work time) to reorienting, according to a Harvard Business Review study.

Method
Observational study: app-usage data from 20 teams (137 users) at three Fortune 500 companies, tracked for up to five weeks (3,200 days of work)
Sample
137 users, 20 teams, 3 Fortune 500 companies
#

48%

of Microsoft 365 customers also run Google Workspace

Okta, Businesses at Work 2025 (infographic)

Observed data · Okta customers using Microsoft 365 · 2025

Method and full statement

Okta found that 48% of its Microsoft 365 customers also run Google Workspace, up from 33% five years earlier, a sign of duplicate productivity suites.

Method
Telemetry: anonymized Okta customer data on apps deployed through the Okta Integration Network (OIN)
Sample
Okta customers using Microsoft 365
#

33%

consolidated redundant apps or accounts

BetterCloud, 2025 State of SaaS

Survey · n≈600 · 2025

Method and full statement

Only 33% of companies consolidated redundant apps or accounts in the past year, according to BetterCloud.

Method
Survey of about 600 IT professionals
Sample
n≈600
#

15

software tools workers juggle every day

Freshworks, The Cost of Complexity Report

Survey · n=706 · 2025

Method and full statement

Workers juggle an average of 15 different software tools and four communication channels every day, according to Freshworks.

Method
Survey of 706 practitioners and decision-makers in IT, CX, finance and operations across the US, UK, India, France, Germany and Australia, plus 25 qualitative interviews
Sample
n=706
#

36%

of CX teams cite toggling between too many tools

Freshworks, The Cost of Complexity Report

Survey · n=706 · 2025

Method and full statement

36% of customer experience teams name toggling between too many tools as a top frustration, according to Freshworks.

Method
Survey of 706 practitioners and decision-makers in IT, CX, finance and operations across the US, UK, India, France, Germany and Australia, plus 25 qualitative interviews
Sample
n=706 (CX subset)
#

33

app or tab switches per worker per day

Lokalise, Tool Fatigue Productivity Report

Survey · n=1,000 · 2025

Method and full statement

Workers switch between tabs, apps or platforms an average of 33 times a day, and 17% switch more than 100 times, according to a 2025 Lokalise survey.

Method
Survey of 1,000 US white-collar knowledge workers across 11 industries whose jobs rely on digital tools
Sample
n=1,000
#

51 min

lost per worker each week to tool fatigue

Lokalise, Tool Fatigue Productivity Report

Survey · n=1,000 · 2025

Method and full statement

Workers lose an average of 51 minutes a week to tool fatigue, more than 44 hours a year, according to Lokalise.

Method
Survey of 1,000 US white-collar knowledge workers across 11 industries whose jobs rely on digital tools
Sample
n=1,000
#
Show all 14 stats in this section

79%

say their company hasn't tried to consolidate tools

Lokalise, Tool Fatigue Productivity Report

Survey · n=1,000 · 2025

Method and full statement

79% of employees say their company hasn't taken steps to reduce tool fatigue or consolidate platforms, according to Lokalise.

Method
Survey of 1,000 US white-collar knowledge workers across 11 industries whose jobs rely on digital tools
Sample
n=1,000
#

74%

see clear evidence of tech overlap and redundancy

Ivanti, 2025 Digital Employee Experience Report

Survey · 3,300+ IT professionals and end users · 2025

Method and full statement

74% of IT professionals see clear evidence of technology overlaps and redundancies in their organizations, yet 63% say consolidating tools is not a high priority, according to Ivanti.

Method
Survey (Ravn Research)
Sample
3,300+ IT professionals and end users
#

11

apps the average desk worker uses (up from 6 in 2019)

Gartner, Gartner Survey Reveals 47% of Digital Workers Struggle to Find the Information Needed to Effectively Perform Their Jobs

Survey · n=4,861 · 2023

Method and full statement

A Gartner survey found the average desk worker uses 11 applications for work, up from six in 2019, and 5% use 26 or more.

Method
Survey of full-time employees using digital technology at organizations with 100+ employees (U.S., U.K., India, China)
Sample
n=4,861
#

3,600+

daily toggles per employee in one supply-chain team

Harvard Business Review, How Much Time and Energy Do We Waste Toggling Between Applications?

Observed data · one Fortune 500 consumer goods organization · 2022

Method and full statement

At one Fortune 500 company, a single supply-chain transaction meant switching about 350 times between 22 apps and websites, adding up to more than 3,600 toggles per employee per day.

Method
Observational study: app-usage data from 20 teams (137 users) at three Fortune 500 companies, tracked for up to five weeks (3,200 days of work); this figure is a single-company example
Sample
one Fortune 500 consumer goods organization
#

13 apps

switched between 30 times a day

Asana (reported by CIO Dive), Anatomy of Work Index 2021

Survey · n=13,123 · 2021

Method and full statement

US employees switch between an average of 13 apps 30 times a day, according to Asana's Anatomy of Work Index 2021.

Method
Survey of 13,123 knowledge workers in eight countries
Sample
n=13,123
#

AI is where the stack grows fastest 10 stats

27

AI-powered SaaS apps per organization

BetterCloud, 2026 State of SaaS

Survey · n=525 · 2026

Method and full statement

Organizations now deploy an average of 27 AI-powered SaaS apps, about 22% of their total portfolio, according to BetterCloud's 2026 State of SaaS report.

Method
Survey of 525 IT and security professionals at SaaS-first organizations
Sample
n=525
#

1,057

apps at organizations fully adopting agentic AI

MuleSoft (Salesforce), 2026 Connectivity Benchmark Report

Survey · n=1,050 IT leaders · 2026

Method and full statement

Organizations that have fully adopted agentic AI manage an average of 1,057 applications, 10% more than the overall average, according to MuleSoft.

Method
Survey of 1,050 IT leaders globally (MuleSoft 2026 Connectivity Benchmark Report)
Sample
n=1,050 IT leaders
#

#1

Anthropic: fastest-growing vendor in every segment

Tropic, The State of Software Procurement in 2026

Observed data · $23B+ tracked spend · 2026

Method and full statement

Anthropic was the fastest-growing software vendor across SMB, mid-market and enterprise buyers in Q2 2026, the first time one vendor topped all three segments, according to Tropic.

Method
Transaction data: negotiated outcomes across $23B+ in tracked spend, 100,000+ negotiations, 30,000+ SKUs across 14,000+ suppliers (Tropic customers)
Sample
$23B+ tracked spend
#

67%

of organizations pay for AI-native tools

Tropic, AI Spending and Pricing Trends H1 2026

Observed data · Tropic customer base · 2026

Method and full statement

67% of organizations now pay for AI-native tools, up from 12% in January 2023, according to Tropic's spend data.

Method
Transaction data across Tropic's customer network
Sample
Tropic customer base
#

4.2

AI tools per mid-market company

Freshworks, The Global Cost of Complexity Report: The Mid-Market AI Complexity Trap

Survey · n=12,021 · 2026

Method and full statement

Mid-market companies use an average of 4.2 AI tools, but only 33% have a formal, consistently applied AI governance framework, according to Freshworks.

Method
Survey of 12,021 IT decision makers (director and above) in the US, UK, Germany, France, Singapore and India at organizations with 250+ employees, including 9,000+ mid-market (up to 5,000 employees)
Sample
n=12,021
#

46% → 69%

of organizations using Gemini alongside other AI apps

Netskope Threat Labs, Cloud and Threat Report: 2026

Observed data · Netskope customers · 2026

Method and full statement

Google Gemini adoption among organizations rose from 46% to 69% in a year, a sign that companies increasingly pay for multiple overlapping generative AI apps, according to Netskope.

Method
Telemetry: anonymized usage data from Netskope security platform customers
Sample
Netskope customers (count not stated on page)
#

40%

of the fastest-growing apps are security tools

Okta, Businesses at Work 2025

Observed data · thousands of Okta customers · 2025

Method and full statement

Security tools make up 40% of the fastest-growing apps in Okta's Businesses at Work 2025 report.

Method
Telemetry: anonymized Okta customer data on apps deployed through the Okta Integration Network (OIN)
Sample
thousands of Okta customers
#

146%

YoY growth for OpenAI, the fastest-growing vendor

Tropic, 2025 Software Buying Trends for Effective Spend Management

Observed data · $11B spend · 2025

Method and full statement

OpenAI was the fastest-growing software vendor of 2024 at 146% year-over-year growth, and 19 of the 20 fastest-growing vendors prominently featured AI, according to Tropic.

Method
Transaction data: analysis of $11B in corporate technology spending across 500+ Tropic customers
Sample
$11B spend; 500+ customers
#
Show all 10 stats in this section

62%

of companies use Salesforce, the most-used tool

Tropic, 2025 Software Buying Trends (blog summary)

Observed data · Tropic customers · 2025

Method and full statement

Salesforce is the most widely used software tool, found at 62% of companies, according to Tropic's 2024 buying data.

Method
Transaction data: analysis of $11B in corporate technology spending across 500+ Tropic customers
Sample
Tropic customers
#

338%

YoY customer growth for Vanta, the fastest-growing app

Okta, Businesses at Work 2024

Observed data · 18,800+ customers · 2024

Method and full statement

Compliance tool Vanta was the fastest-growing app in Okta's 2024 report, with 338% year-over-year growth in customers deploying it.

Method
Telemetry: aggregated, anonymized data from Okta's 18,800+ global customers and the Okta Integration Network (7,000+ integrations); data Nov 1, 2022 to Oct 31, 2023
Sample
18,800+ customers
#

Shadow IT · 75 stats

Shadow IT statistics

Most apps never pass through IT. In Torii's data, 61.3% of the average portfolio is shadow IT.

Torii dataThe shadow iceberg: what IT has actually reviewedShare of apps in the average portfolio, by governance status.
  • Shadow IT 61.3%
  • Blocked 17.1%
  • Approved 15.5%
  • In review 4.6%
  • Need to close 1.5%

Source: Torii, SaaS Benchmark Annual Report 2026, "Shadow Iceberg" chart.

See the full chart in the benchmark report
Torii dataWhere shadow apps come fromShare of all shadow apps, by category.
  • Productivity23.0%
  • Developer tools16.3%
  • Design15.7%
  • Sales & marketing14.3%
  • Operations11.8%
  • IT & security6.9%
  • HR5.6%
  • Analytics & BI2.6%
  • Project mgmt1.9%
  • Customer success1.2%
  • Finance0.7%

Source: Torii, SaaS Benchmark Annual Report 2026, "Shadow Categories" chart.

See the full chart in the benchmark report

Most apps arrive without IT 25 stats

Torii data

61.3%

of apps in a portfolio are shadow IT

Torii, SaaS Benchmark Annual Report 2026

Observed data · 2026

Method and full statement

61.3% of apps in the average portfolio are shadow IT, discovered through usage, browser activity or direct signup rather than procurement, according to Torii's 2026 SaaS Benchmark.

Method
Observed: aggregated, anonymized discovery data from environments Torii connects to
Sample
not published
#
Torii data

15.5%

of apps are formally approved

Torii, SaaS Benchmark Annual Report 2026

Observed data · 2026

Method and full statement

Only 15.5% of applications are formally sanctioned tools, according to Torii's 2026 SaaS Benchmark.

Method
Observed: aggregated, anonymized discovery data from environments Torii connects to
Sample
not published
#

98%

of executives bypass IT for tech purchases

Capgemini Research Institute, On-Demand Tech (FinOps) report

Survey · n=1,000 executives · 2025

Method and full statement

98% of executives admit to bypassing IT when buying technology, according to Capgemini Research Institute.

Method
Survey of 1,000 executives at organizations with $1B+ annual revenue using cloud, SaaS and GenAI, across 12 sectors and 14 countries; fielded May 2025
Sample
n=1,000 executives
#

24%

of total IT budgets is shadow IT

IBM Institute for Business Value, Intelligent IT automation

Survey · 680 companies, 18 industries, 21 countries · 2025

Method and full statement

Shadow IT, purchased by business units without IT oversight, represents 24% of total IT budgets, according to IBM Institute for Business Value research.

Method
Benchmarking data from IT leaders (CIOs, CTOs, VPs/directors of IT)
Sample
680 companies, 18 industries, 21 countries
#

14 per 10

tools actually in use for every 10 a company knows about

Cledara, The 2025 Software Spend Report

Observed data · 200+ companies surveyed · 2024

Method and full statement

Businesses underestimate their software usage by 40% on average: for every 10 tools a company thinks it uses, 14 are actually in play, according to Cledara.

Method
Cledara transaction data (1M+ transactions with 5,000+ vendors) plus a survey of 200+ tech companies with fewer than 200 staff in the US, UK and EU
Sample
200+ companies surveyed; 1M+ transactions
#

75%

of employees will build or buy tech outside IT's view by 2027

Gartner, Top Predictions for Cybersecurity 2023-2024 (Gartner analyst presentation at RSAC 2024)

Forecast · 2023

Method and full statement

Gartner predicts that by 2027, 75% of employees will acquire, modify or create technology outside IT's visibility, up from 41% in 2022.

Method
Analyst forecast (strategic planning assumption); 41% baseline from Gartner's 2022 survey of employees doing technology work
Sample
not stated for the forecast
#
Torii data

17.1%

of apps are blocked

Torii, SaaS Benchmark Annual Report 2026

Observed data · 2026

Method and full statement

More apps are blocked (17.1%) than approved (15.5%), according to Torii's 2026 SaaS Benchmark.

Method
Observed: aggregated, anonymized discovery data from environments Torii connects to
Sample
not published
#
Show all 25 stats in this section
Torii data

~70%

of shadow apps sit in 4 categories

Torii, SaaS Benchmark Annual Report 2026

Observed data · 2026

Method and full statement

Productivity, Developer Tools, Design, and Sales and Marketing tools account for about 70% of all shadow apps, according to Torii's 2026 SaaS Benchmark.

Method
Observed: aggregated, anonymized discovery data from environments Torii connects to
Sample
not published
#
Torii data

23.0%

of shadow apps are productivity tools

Torii, SaaS Benchmark Annual Report 2026

Observed data · 2026

Method and full statement

Productivity tools are the largest shadow IT category at 23.0% of all shadow apps, according to Torii's 2026 SaaS Benchmark.

Method
Observed: aggregated, anonymized discovery data from environments Torii connects to
Sample
not published
#

56%

of apps in use carry IT approval

BetterCloud, 2026 State of SaaS

Survey · n=525 · 2026

Method and full statement

Only 56% of the apps in use at organizations carry IT approval, according to BetterCloud's 2026 State of SaaS report.

Method
Survey of 525 IT and security professionals at SaaS-first organizations
Sample
n=525
#

21%

found new unsanctioned SaaS and AI tools in a year

BetterCloud, 2026 State of SaaS

Survey · n=525 · 2026

Method and full statement

21% of organizations discovered new, unsanctioned SaaS and AI tools in use over the past 12 months, according to BetterCloud.

Method
Survey of 525 IT and security professionals at SaaS-first organizations
Sample
n=525
#

55%

of employees adopt SaaS without security's involvement

Cloud Security Alliance (commissioned by Valence Security), State of SaaS Security Report 2025

Survey · n=420 IT and security professionals · 2025

Method and full statement

According to the Cloud Security Alliance's State of SaaS Security Report 2025, 55% of employees adopt SaaS without security's involvement.

Method
Survey: CSA survey of IT and security professionals conducted January 2025, commissioned by Valence Security
Sample
n=420 IT and security professionals
#

48%

of SaaS spending is driven by business units

Capgemini Research Institute, On-Demand Tech (FinOps) report

Survey · n=1,000 executives · 2025

Method and full statement

Business units, not IT, now drive 48% of SaaS spending, according to a 2025 Capgemini Research Institute survey of 1,000 large-company executives.

Method
Survey of 1,000 executives at organizations with $1B+ annual revenue using cloud, SaaS and GenAI, across 12 sectors and 14 countries; fielded May 2025
Sample
n=1,000 executives
#

47%

of IT pros frustrated at being left out of tool buying

Auvik, 2025 IT Trends Report

Survey · 2025

Method and full statement

47% of IT professionals are frustrated at not being consulted earlier in the tool procurement process, according to Auvik's 2025 IT Trends Report.

Method
Survey of internal IT and MSP professionals
Sample
not stated
#

90%

of SaaS apps in organizations are unmanaged

Grip Security, 2025 SaaS Security Risks Report

Observed data · 2024

Method and full statement

Grip Security's 2025 SaaS Security Risks report found 90% of SaaS applications inside organizations are unmanaged.

Method
Telemetry: anonymized data from Grip's SaaS Security Control Plane covering 29M+ SaaS user accounts, 1.7M identities and 23,987 SaaS applications
Sample
29M+ SaaS user accounts, 1.7M identities, 23,987 SaaS apps
#

85%

increase in SaaS accounts per user over two years

Grip Security, 2025 SaaS Security Risks Report

Observed data · 2024

Method and full statement

The number of SaaS applications used in an enterprise grew 40% over two years, with an 85% increase in SaaS accounts per user, according to Grip Security.

Method
Telemetry: anonymized data from Grip's SaaS Security Control Plane covering 29M+ SaaS user accounts, 1.7M identities and 23,987 SaaS applications
Sample
29M+ SaaS user accounts, 1.7M identities, 23,987 SaaS apps
#

48%

of enterprise apps are shadow IT

Productiv (via CIO Dive), 2024 State of SaaS

Observed data · Productiv customer portfolios · 2024

Method and full statement

Productiv's 2024 State of SaaS analysis found shadow IT made up 48% of the average enterprise app portfolio in 2023, down from 53% the year before.

Method
Telemetry: Productiv analysis of 100B+ app usage data points across nearly 100M SaaS licenses; shadow IT = non-managed apps that are expensed, found by network monitoring, or seen via Google SSO
Sample
Productiv customer portfolios (avg 342 apps)
#

#1

shadow IT app in 2023: ChatGPT

Productiv (via CIO Dive), 2024 State of SaaS

Observed data · Productiv customers · 2024

Method and full statement

ChatGPT became the most prevalent shadow IT application in 2023, overtaking LinkedIn, Canva and Adobe Acrobat, according to Productiv.

Method
Telemetry: Productiv analysis of 100B+ app usage data points across nearly 100M SaaS licenses
Sample
Productiv customers
#

68%

say business units buy SaaS and cloud IT doesn't know about

Flexera, 2025 IT Priorities Report

Survey · 2024

Method and full statement

68% of IT leaders say business units are buying more SaaS and cloud than IT is aware of, according to Flexera's 2025 IT Priorities Report.

Method
Annual survey of IT leaders; sample size not stated in release
Sample
not stated
#

57%

of SMBs have had high-impact shadow IT efforts

Capterra (Gartner Digital Markets), Shadow IT Teams Cost Your SMB Time and Money

Survey · n=300 · 2023

Method and full statement

Capterra found 57% of small and midsize businesses have had high-impact shadow IT efforts, and 85% of those have a shadow IT team operating right now.

Method
Survey: Capterra survey, January 2023, of 300 IT project managers, SMB leaders and IT leaders at businesses with 1,000 or fewer employees and <=$500M revenue that had high-impact shadow IT experience
Sample
n=300
#

65%

of SaaS apps accessed were shadow IT

Cledara, The State of Shadow IT

Observed data · 200 companies · 2023

Method and full statement

Cledara's State of Shadow IT study found 65% of all SaaS applications accessed at 200 companies were shadow IT, an average of 75 unapproved tools per company.

Method
Telemetry: Cledara Engage browser tool deployed on all employees' computers at 200 companies, counting page loads of unauthorized SaaS products over 30 days in Sept to Oct 2023
Sample
200 companies (many in regulated sectors; small/mid-size tech companies)
#

3.5%

of companies kept shadow IT under 20% of usage

Cledara, The State of Shadow IT

Observed data · 200 companies · 2023

Method and full statement

Only 3.5% of companies in Cledara's study had shadow IT making up less than 20% of their tool usage.

Method
Telemetry: Cledara Engage browser tool deployed on all employees' computers at 200 companies, counting page loads of unauthorized SaaS products over 30 days in Sept to Oct 2023
Sample
200 companies
#

65%

of SaaS apps were unsanctioned

BetterCloud, 2023 State of SaaSOps

Survey · n=743 · 2023

Method and full statement

In 2022, 65% of SaaS apps were unsanctioned, adopted by users without IT's knowledge or approval, according to BetterCloud's State of SaaSOps survey.

Method
Survey: online survey of 743 IT respondents (BetterCloud community, customers, non-customers and market research panel)
Sample
n=743
#

41%

of employees are business technologists working outside IT

Gartner, Gartner Survey Finds Rise in Business Technologists is Driving Funding for Tech Purchases Outside of IT (press release)

Survey · 2022

Method and full statement

Gartner research found 41% of employees are 'business technologists' who build technology or analytics capabilities outside of IT departments.

Method
Gartner research on business technologists (Gartner 2021 Business Technologist Survey); quoted in the press release
Sample
not stated in release
#

74%

of tech purchases are funded partly by business units outside IT

Gartner, Gartner Survey Finds Rise in Business Technologists is Driving Funding for Tech Purchases Outside of IT (press release)

Survey · n=1,120 · 2022

Method and full statement

Gartner found 74% of technology purchases are funded at least partly by business units outside of IT; only 26% are funded entirely by the IT organization.

Method
Survey: Gartner survey of 1,120 manager-level-or-higher respondents at organizations with $1M+ annual revenue in North America, Western Europe and Asia/Pacific, about large technology purchases
Sample
n=1,120
#

Why employees go around IT 8 stats

52%

of employees have downloaded apps without IT approval

1Password, Annual Report 2025: The Access-Trust Gap

Survey · n=5,200 knowledge workers · 2025

Method and full statement

According to 1Password's 2025 Access-Trust Gap report, 52% of employees have downloaded apps without IT approval.

Method
Survey: online survey of 5,200 desk-based knowledge workers (including IT and security professionals) in the U.S., Canada, UK, Germany, France and Singapore
Sample
n=5,200 knowledge workers
#

42%

of employees bypass IT to boost productivity

1Password, Annual Report 2025: The Access-Trust Gap (press release)

Survey · n=5,200 knowledge workers · 2025

Method and full statement

1Password's 2025 Access-Trust Gap report found 42% of employees bypass IT to boost their productivity.

Method
Survey: online survey of 5,200 desk-based knowledge workers (including IT and security professionals) in the U.S., Canada, UK, Germany, France and Singapore
Sample
n=5,200 knowledge workers; press release says its North American figures reflect 1,500 workers
#

55%

of Singapore employees download apps without IT approval

1Password, Annual Report 2025: The Access-Trust Gap (press release)

Survey · n=5,200 knowledge workers · 2025

Method and full statement

Shadow IT varies by country: 55% of employees in Singapore admit downloading apps without IT approval, versus 46% in Germany, 44% in the U.S., 43% in the UK and 33% in France, per 1Password's 2025 report.

Method
Survey: online survey of 5,200 desk-based knowledge workers (including IT and security professionals) in the U.S., Canada, UK, Germany, France and Singapore
Sample
n=5,200 knowledge workers (per-country sizes not stated)
#

27%

of office workers regularly use unauthorized tools out of frustration

Ivanti, 2025 Digital Employee Experience (DEX) Report

Survey · n=3,300+ IT professionals and end users · 2025

Method and full statement

27% of office workers say they regularly use unauthorized tools and apps out of frustration with their employer-provided tools, according to Ivanti's 2025 Digital Employee Experience Report.

Method
Survey: Ivanti survey of 3,300+ IT professionals and end users worldwide, administered by Ravn Research (panel via MSI Advanced Customer Insights); results unweighted
Sample
n=3,300+ IT professionals and end users
#

~40%

of office workers bypass IT support to fix tech problems themselves

Ivanti, 2025 Digital Employee Experience (DEX) Report

Survey · n=3,300+ IT professionals and end users · 2025

Method and full statement

Nearly 40% of office workers say they bypass employer-provided tech support entirely when they hit a technology problem, usually because they can fix it faster themselves, per Ivanti.

Method
Survey: Ivanti survey of 3,300+ IT professionals and end users worldwide, administered by Ravn Research (panel via MSI Advanced Customer Insights); results unweighted
Sample
n=3,300+ IT professionals and end users
#

4.9 sec

between each use of an unauthorized app

Cledara, The State of Shadow IT

Observed data · 200 companies · 2023

Method and full statement

Across 200 companies, Cledara counted 23.6 million instances of shadow IT usage over 30 days: an employee opened an unauthorized app every 4.9 seconds of the workday.

Method
Telemetry: Cledara Engage browser tool deployed on all employees' computers at 200 companies, counting page loads of unauthorized SaaS products over 30 days in Sept to Oct 2023
Sample
200 companies; 2,259 unauthorized software platforms
#

Personal accounts, devices and extensions 23 stats

68%

of corporate-account SaaS logins bypass SSO

LayerX Security, Browser Security Report 2025

Observed data · 2025

Method and full statement

Per LayerX's Browser Security Report 2025, 68% of logins to SaaS apps using corporate accounts happen without single sign-on.

Method
Telemetry: LayerX browser-extension telemetry from 'millions of enterprise browser sessions' across LayerX enterprise customers
Sample
not stated
#

78%

of employees ignore BYOD bans

Ivanti, Securing the Borderless Digital Landscape

Survey · 2025

Method and full statement

Where BYOD is banned, 78% of employees use personal devices for work anyway, according to Ivanti's Securing the Borderless Digital Landscape report.

Method
Survey: two Ivanti surveys (Oct 2024 and Feb 2025) of 600+ executive leaders, 3,000 IT and cybersecurity professionals and 6,000 office workers worldwide, administered by Ravn Research; unweighted
Sample
600+ executives, 3,000 IT/security pros, 6,000 office workers
#

31%

of users upload work data to personal cloud apps each month

Netskope, Cloud and Threat Report: 2026

Observed data · Netskope One customer organizations · 2026

Method and full statement

According to Netskope's Cloud and Threat Report 2026, 31% of users in the average organization upload data to personal cloud apps every month.

Method
Telemetry: anonymized usage data collected by the Netskope One platform, Oct 1, 2024 to Oct 31, 2025
Sample
Netskope One customer organizations (count not stated; 'millions of users')
#

21%

rise in users uploading data to personal apps in a year

Netskope, Cloud and Threat Report: 2026

Observed data · Netskope One customer organizations · 2026

Method and full statement

Netskope reports the share of users uploading data to personal cloud apps grew 21% over the past year.

Method
Telemetry: anonymized usage data collected by the Netskope One platform, Oct 1, 2024 to Oct 31, 2025
Sample
Netskope One customer organizations (count not stated; 'millions of users')
#

43%

of organizations put real-time controls on personal Google Drive

Netskope, Cloud and Threat Report: 2026

Observed data · Netskope One customer organizations · 2026

Method and full statement

Google Drive is the personal app organizations most often control, with 43% applying real-time protections, followed by Gmail (31%) and OneDrive (28%), per Netskope.

Method
Telemetry: anonymized usage data collected by the Netskope One platform, Oct 1, 2024 to Oct 31, 2025
Sample
Netskope One customer organizations (count not stated; 'millions of users')
#

43%

of SaaS apps accessed with personal credentials

LayerX Security, Browser Security Report 2025

Observed data · 2025

Method and full statement

LayerX's Browser Security Report 2025 found 43% of SaaS applications in organizational networks are accessed with personal (non-corporate) credentials.

Method
Telemetry: LayerX browser-extension telemetry from 'millions of enterprise browser sessions' across LayerX enterprise customers
Sample
not stated
#

83%

of ERP logins happen without SSO

LayerX Security, Browser Security Report 2025

Observed data · 2025

Method and full statement

LayerX telemetry shows 83% of logins to ERP systems and 71% of logins to CRM systems happen without SSO.

Method
Telemetry: LayerX browser-extension telemetry from 'millions of enterprise browser sessions' across LayerX enterprise customers
Sample
not stated
#

87%

of chat/IM app usage is on personal accounts

LayerX Security, Browser Security Report 2025

Observed data · 2025

Method and full statement

87% of employee activity in chat and instant-messaging apps happens through personal, non-corporate accounts, according to LayerX's Browser Security Report 2025.

Method
Telemetry: LayerX browser-extension telemetry from 'millions of enterprise browser sessions' across LayerX enterprise customers
Sample
not stated
#
Show all 23 stats in this section

77%

of Salesforce logins use non-corporate accounts

LayerX Security, Enterprise AI and SaaS Data Security Report 2025

Observed data · 2025

Method and full statement

Even in Salesforce, 77% of logins observed by LayerX came from non-corporate accounts, as did 68% of Microsoft Online and 64% of Zoom logins.

Method
Telemetry: LayerX in-browser enterprise browsing telemetry from its enterprise customer base
Sample
not stated
#

38%

of file-sharing uploads go through personal accounts

LayerX Security, Enterprise AI and SaaS Data Security Report 2025

Observed data · 2025

Method and full statement

38% of file uploads to file storage and sharing platforms are made through personal accounts, and 41% of files uploaded there contain PII or payment card data, per LayerX.

Method
Telemetry: LayerX in-browser enterprise browsing telemetry from its enterprise customer base
Sample
not stated
#

99%

of enterprise users run at least one browser extension

LayerX Security, Enterprise Browser Extension Security Report 2025 (press release)

Observed data · tens of thousands of enterprise users · 2025

Method and full statement

99% of enterprise users have at least one browser extension installed, and 53% have more than 10, according to LayerX's Enterprise Browser Extension Security Report 2025.

Method
Telemetry: real-life usage data from enterprise users in LayerX's customer base ('tens of thousands of real enterprise users'), combined with public extension-store data
Sample
tens of thousands of enterprise users
#

53%

of enterprise users run high-risk-permission extensions

LayerX Security, Enterprise Browser Extension Security Report 2025 (press release)

Observed data · tens of thousands of enterprise users · 2025

Method and full statement

53% of enterprise users have installed browser extensions with 'high' or 'critical' permission scopes, able to access cookies, passwords and browsing data, per LayerX.

Method
Telemetry: real-life usage data from enterprise users in LayerX's customer base ('tens of thousands of real enterprise users'), combined with public extension-store data
Sample
tens of thousands of enterprise users
#

26%

of enterprise browser extensions were side-loaded

LayerX Security, Browser Security Report 2025

Observed data · 2025

Method and full statement

17% of browser extensions installed by enterprise users come from non-official stores and 26% are side-loaded by external applications, according to LayerX's Browser Security Report 2025.

Method
Telemetry: LayerX browser-extension telemetry from 'millions of enterprise browser sessions' across LayerX enterprise customers
Sample
not stated
#

54%

of extension publishers use a free webmail account

LayerX Security, Enterprise Browser Extension Security Report 2025 (press release)

Observed data · tens of thousands of enterprise users · 2025

Method and full statement

54% of browser extension publishers use a free webmail account, and 79% have published only a single extension, per LayerX.

Method
Telemetry: real-life usage data from enterprise users in LayerX's customer base ('tens of thousands of real enterprise users'), combined with public extension-store data
Sample
tens of thousands of enterprise users
#

51%

of browser extensions not updated in a year

LayerX Security, Enterprise Browser Extension Security Report 2025 (press release)

Observed data · tens of thousands of enterprise users · 2025

Method and full statement

51% of all browser extensions haven't received an update in over a year, LayerX reports.

Method
Telemetry: real-life usage data from enterprise users in LayerX's customer base ('tens of thousands of real enterprise users'), combined with public extension-store data
Sample
tens of thousands of enterprise users
#

46%

of infostealer-hit devices with corporate logins were unmanaged

Verizon, 2025 Data Breach Investigations Report

Observed data · 2025

Method and full statement

Verizon's 2025 Data Breach Investigations Report found 46% of systems compromised by infostealer malware that held corporate logins were non-managed devices, most likely personal devices or devices used outside policy.

Method
Breach data: analysis of infostealer credential logs and marketplace postings; DBIR analyzed 22,000+ incidents incl. 12,195 confirmed breaches
Sample
Subset of infostealer logs with business-app domains and OS info
#

3 in 4

IT workers say BYOD is routine

Ivanti, Securing the Borderless Digital Landscape

Survey · 2025

Method and full statement

Three in four IT workers say BYOD is a regular occurrence at their organization, though only 52% say it is explicitly allowed, per Ivanti.

Method
Survey: two Ivanti surveys (Oct 2024 and Feb 2025) of 600+ executive leaders, 3,000 IT and cybersecurity professionals and 6,000 office workers worldwide, administered by Ravn Research; unweighted
Sample
600+ executives, 3,000 IT/security pros, 6,000 office workers
#

84%

of organizations have employees on unmanaged devices

Cisco, 2025 Cybersecurity Readiness Index

Survey · n=8,000 · 2025

Method and full statement

84% of organizations say employees access company networks from unmanaged devices, according to Cisco's 2025 Cybersecurity Readiness Index.

Method
Survey: double-blind online survey of 8,000 private-sector business and cybersecurity leaders across 30 markets
Sample
n=8,000
#

1 in 2

office workers log into work systems from personal devices

Ivanti, Digital Employee Experience (DEX) Security Research Report

Survey · 20,000+ across three surveys · 2024

Method and full statement

One in two office workers use personal devices to log into work networks and software, and 32% of them say their employer doesn't know, according to Ivanti research.

Method
Survey: based in part on three Ivanti surveys (2024 Everywhere Work, 2024 State of Cybersecurity, 2024 DEX) covering 20,000+ executives, IT pros, security pros and office workers
Sample
20,000+ across three surveys (subset for this question not stated)
#

47%

of companies allow access from unmanaged devices

1Password (Kolide), The Shadow IT Report

Survey · 2024

Method and full statement

47% of companies let employees access company resources from unmanaged devices using credentials alone, according to Kolide's (now 1Password) Shadow IT report.

Method
Survey: Kolide survey of knowledge workers incl. IT, security, developers, executives (late 2023); sample size not stated on this page
Sample
not stated
#

49%

of developers write code on personal devices

1Password (Kolide), The Shadow IT Report

Survey · 2024

Method and full statement

49% of developers report doing software development on personal devices, and 35% of security professionals use personal devices to manage cloud infrastructure, per Kolide's Shadow IT report.

Method
Survey: Kolide survey of knowledge workers (late 2023); sample size not stated on this page
Sample
not stated
#

35%

of orgs saw work email forwarded to personal accounts

BetterCloud, 2023 State of SaaSOps

Survey · n=743 · 2023

Method and full statement

35% of IT respondents said users had forwarded work email to their personal email accounts, per BetterCloud's 2023 State of SaaSOps report.

Method
Survey: online survey of 743 IT respondents
Sample
n=743
#

1,454

browser extensions at the average 2,000+ employee company

Spin.AI, Browser Extension Risk Report

Observed data · Spin.AI customers · 2023

Method and full statement

Companies with more than 2,000 employees have an average of 1,454 different browser extensions installed, according to Spin.AI's analysis of its customers.

Method
Telemetry: Spin.AI assessment of 1,000,000+ browser extensions and third-party OAuth apps seen across its customers
Sample
Spin.AI customers (count not stated)
#

What shadow IT costs 19 stats

60%

of insider threat incidents involve personal cloud apps

Netskope, Cloud and Threat Report: 2026

Observed data · Netskope One customer organizations · 2026

Method and full statement

Netskope's Cloud and Threat Report 2026 found that 60% of insider threat incidents involve personal cloud app instances.

Method
Telemetry: anonymized usage data collected by the Netskope One platform, Oct 1, 2024 to Oct 31, 2025
Sample
Netskope One customer organizations (count not stated; 'millions of users')
#

54%

of personal-app policy violations involve regulated data

Netskope, Cloud and Threat Report: 2026

Observed data · Netskope One customer organizations · 2026

Method and full statement

Regulated data (personal, financial and healthcare information) accounts for 54% of data policy violations linked to personal cloud apps, per Netskope's Cloud and Threat Report 2026.

Method
Telemetry: anonymized usage data collected by the Netskope One platform, Oct 1, 2024 to Oct 31, 2025
Sample
Netskope One customer organizations (count not stated; 'millions of users')
#

77%

of organizations control data sent to personal apps

Netskope, Cloud and Threat Report: 2026

Observed data · Netskope One customer organizations · 2026

Method and full statement

77% of organizations now place real-time controls on data being sent to personal apps, up from 70% a year earlier, according to Netskope.

Method
Telemetry: anonymized usage data collected by the Netskope One platform, Oct 1, 2024 to Oct 31, 2025
Sample
Netskope One customer organizations (count not stated; 'millions of users')
#

49%

of IT/security pros say unapproved software has weakened their defenses

1Password, Annual Report 2025: The Access-Trust Gap (press release)

Survey · n=5,200 knowledge workers · 2025

Method and full statement

In 1Password's 2025 survey, 49% of security and IT professionals said employee use of unapproved software has compromised their ability to maintain adequate protections.

Method
Survey: online survey of 5,200 desk-based knowledge workers (including IT and security professionals) in the U.S., Canada, UK, Germany, France and Singapore; this figure is from the IT/security professional subset
Sample
n=5,200 knowledge workers (IT/security subset size not stated)
#

56%

of organizations see sensitive data uploaded to unauthorized apps

Cloud Security Alliance (commissioned by Valence Security), State of SaaS Security Report 2025

Survey · n=420 IT and security professionals · 2025

Method and full statement

56% of organizations say employees upload sensitive data to unauthorized SaaS apps, per the Cloud Security Alliance's 2025 State of SaaS Security Report.

Method
Survey: CSA survey of IT and security professionals conducted January 2025, commissioned by Valence Security
Sample
n=420 IT and security professionals
#

90%

of SME IT pros worry about unauthorized apps

JumpCloud, SME IT Trends Report Q1 2025

Survey · n=900 SME IT professionals · 2025

Method and full statement

In JumpCloud's Q1 2025 SME IT Trends survey, 90% of SME IT professionals said they worry about employees using unauthorized apps, yet 38% have no full app discovery process.

Method
Survey: JumpCloud-commissioned survey of 900 SME IT professionals in the U.S., UK and Australia
Sample
n=900 SME IT professionals
#

38%

of SMEs lack a full app discovery process

JumpCloud, SME IT Trends Report Q1 2025

Survey · n=900 SME IT professionals · 2025

Method and full statement

38% of SME IT professionals say they don't have a full process for discovering the apps employees use, according to JumpCloud's Q1 2025 SME IT Trends report.

Method
Survey: JumpCloud-commissioned survey of 900 SME IT professionals in the U.S., UK and Australia
Sample
n=900 SME IT professionals
#

~60%

of IT pros still worry about shadow IT

BetterCloud, State of SaaS 2025

Survey · n≈600 IT professionals · 2025

Method and full statement

Nearly 60% of IT professionals remain concerned about the risks of shadow IT, according to BetterCloud's State of SaaS 2025 report.

Method
Survey: BetterCloud survey of nearly 600 IT professionals (12th annual)
Sample
n≈600 IT professionals
#
Show all 19 stats in this section

45%

of IT pros lack sufficient data about shadow IT

Ivanti, Securing the Borderless Digital Landscape

Survey · 2025

Method and full statement

45% of IT professionals say they lack sufficient data about shadow IT, and 38% lack sufficient data about the devices accessing their network, per Ivanti.

Method
Survey: two Ivanti surveys (Oct 2024 and Feb 2025) of 600+ executive leaders, 3,000 IT and cybersecurity professionals and 6,000 office workers worldwide, administered by Ravn Research; unweighted
Sample
600+ executives, 3,000 IT/security pros, 6,000 office workers
#

58%

of IT leaders hit issues from unsanctioned SaaS

Flexera, 2026 IT Priorities Report

Survey · n=834 · 2025

Method and full statement

58% of IT leaders have encountered issues due to unsanctioned SaaS usage, according to Flexera's 2026 IT Priorities Report.

Method
Survey of global IT decision-makers
Sample
n=834
#

1 in 3

breaches involved shadow data

IBM / Ponemon Institute, Cost of a Data Breach Report 2024

Observed data · 604 breached organizations · 2024

Method and full statement

IBM's Cost of a Data Breach Report 2024 found more than one-third of breaches involved shadow data stored in unmanaged data sources.

Method
Breach data: Ponemon Institute interviews/analysis of real-world breaches at 604 organizations globally, sponsored and analyzed by IBM
Sample
604 breached organizations
#

37%

of SME breaches in H1 2024 blamed on shadow IT

JumpCloud, SME IT Trends Report (Q3 2024)

Survey · n=612 SME IT decision-makers · 2024

Method and full statement

SME IT leaders surveyed by JumpCloud attributed 37% of the breaches their organizations suffered in the first half of 2024 to shadow IT.

Method
Survey: JumpCloud-commissioned survey of 612 IT decision-makers at SMEs in the U.S. and UK
Sample
n=612 SME IT decision-makers
#

84%

of SMEs are concerned about shadow IT

JumpCloud, SME IT Trends Report (Q3 2024)

Survey · n=612 SME IT decision-makers · 2024

Method and full statement

84% of SMEs are concerned about shadow IT, according to JumpCloud's mid-2024 SME IT Trends survey.

Method
Survey: JumpCloud-commissioned survey of 612 IT decision-makers at SMEs in the U.S. and UK
Sample
n=612 SME IT decision-makers
#

11%

of companies hit by incidents caused by shadow IT

Kaspersky, In the shadows: the risks unauthorised IT products pose to business (press release; data from Kaspersky Human Factor 360 report 2023)

Survey · n=1,260 IT/IT security professionals · 2023

Method and full statement

Kaspersky research found 11% of companies worldwide suffered cyber incidents caused by employees' use of shadow IT over two years; in the IT industry, 16% of incidents were due to shadow IT.

Method
Survey: Arlington Research for Kaspersky, 1,260 interviews with manager-level IT and IT security staff at SMEs (100+ employees) and enterprises (1,000+) in 19 countries, 2023
Sample
n=1,260 IT/IT security professionals
#

13%

of U.S. companies' cyber incidents caused by shadow IT

Kaspersky, Kaspersky uncovers the risks unauthorized IT products pose to businesses (press release)

Survey · n=1,260 globally · 2023

Method and full statement

In the U.S., 13% of cyber incidents companies suffered over two years were caused by the use of shadow IT, according to Kaspersky.

Method
Survey: Arlington Research for Kaspersky (Human Factor 360, 2023), manager-level IT/IT security respondents in 19 countries
Sample
n=1,260 globally (U.S. subset size not stated)
#

76%

of SMBs say shadow IT posed a moderate-to-severe cyber threat

Capterra (Gartner Digital Markets), Shadow IT Teams Cost Your SMB Time and Money

Survey · n=300 · 2023

Method and full statement

76% of SMBs that had high-impact shadow IT efforts say the effort posed a moderate to severe cybersecurity threat, per Capterra.

Method
Survey: Capterra survey, January 2023, of 300 IT project managers, SMB leaders and IT leaders at businesses with 1,000 or fewer employees and <=$500M revenue that had high-impact shadow IT experience
Sample
n=300
#

89%

of SMBs saw negative financial consequences from shadow IT

Capterra (Gartner Digital Markets), Shadow IT Teams Cost Your SMB Time and Money

Survey · n=300 · 2023

Method and full statement

89% of SMBs with high-impact shadow IT efforts report negative financial consequences, yet 80% also report a positive long-term financial impact, Capterra found.

Method
Survey: Capterra survey, January 2023, of 300 IT project managers, SMB leaders and IT leaders at businesses with 1,000 or fewer employees and <=$500M revenue that had high-impact shadow IT experience
Sample
n=300
#

91%

of SMBs struggle to integrate shadow IT work

Capterra (Gartner Digital Markets), Shadow IT Teams Cost Your SMB Time and Money

Survey · n=300 · 2023

Method and full statement

91% of SMBs that had high-impact shadow IT efforts report challenges integrating the shadow IT work into their official environments, according to Capterra.

Method
Survey: Capterra survey, January 2023, of 300 IT project managers, SMB leaders and IT leaders at businesses with 1,000 or fewer employees and <=$500M revenue that had high-impact shadow IT experience
Sample
n=300
#

35-40%

of SaaS spend is shadow IT at the median company

Cledara, The True Cost of Shadow IT (blog)

Observed data

Method and full statement

Cledara's analysis of SaaS spend data finds shadow IT accounts for about 35-40% of total SaaS spend at the median company, and as much as 60-70% at some.

Method
Cledara analysis of its customers' software spend data; method not stated in detail
Sample
not stated
#

Shadow AI · 95 stats

Shadow AI statistics

AI is now the quickest way around IT: 26 of the top 50 shadow IT apps are pure-play AI tools.

Torii dataNew AI-native apps discovered each yearFrom 11 in 2020 to 694 in 2025.
112020
242021
592022
3172023
4362024
6942025

Source: Torii, SaaS Benchmark Annual Report 2026, "New AI Apps Discovered" chart.

See the full chart in the benchmark report
Torii dataThe newer the model, the more of its use is shadowAdoption rate Shadow rate, as charted (0 to 100).
  • ChatGPT95 / 28
  • Claude AI88 / 49
  • DeepSeek67 / 66
  • Grok65 / 76
  • Gemini Code Assist61 / 73
  • Mistral AI40 / 70
  • Google Gemini23 / 55

Source: Torii, SaaS Benchmark Annual Report 2026, "LLM Adoption vs. Shadow IT" chart. The report does not state the denominator for either rate.

See the full chart in the benchmark report

Employees bring their own AI 25 stats

57%

of employees hide or don't disclose AI use

University of Melbourne and KPMG, Trust, attitudes and use of Artificial Intelligence: A global study 2025

Survey · n=48,340 people across 47 countries · 2025

Method and full statement

According to the University of Melbourne and KPMG's 2025 global study, 57% of employees admit to hiding their AI use or presenting AI-generated content as their own.

Method
Online survey of nationally representative samples of adults in 47 countries; workplace findings from the employed subsample
Sample
n=48,340 people across 47 countries
#

78%

of AI users bring their own AI tools to work

Microsoft and LinkedIn, 2024 Work Trend Index Annual Report

Survey · n=31,000 people in 31 countries · 2024

Method and full statement

According to Microsoft and LinkedIn's 2024 Work Trend Index, 78% of AI users at work are bringing their own AI tools to work (BYOAI).

Method
Survey of 31,000 knowledge workers across 31 countries, plus LinkedIn labor and hiring trends and Microsoft 365 productivity signals
Sample
n=31,000 people in 31 countries
#
Torii data

95.3%

adoption rate for ChatGPT, the top AI app

Torii, SaaS Benchmark Annual Report 2026

Observed data · 2026

Method and full statement

ChatGPT leads Torii's AI Leaders of 2025 with a 95.3% adoption rate, followed by Zapier (93.9%) and Grammarly (93.3%), according to Torii's 2026 SaaS Benchmark.

Method
Observed: aggregated, anonymized discovery data from environments Torii connects to
Sample
not published
#
Torii data

76%

shadow rate for Grok

Torii, SaaS Benchmark Annual Report 2026

Observed data · 2026

Method and full statement

Grok has a 76% shadow rate against 65% adoption, compared with ChatGPT's 28% shadow rate, according to Torii's 2026 SaaS Benchmark LLM adoption vs shadow IT chart.

Method
Observed: aggregated, anonymized discovery data from environments Torii connects to
Sample
not published
#

47%

of genAI users use personal AI apps

Netskope Threat Labs, Cloud and Threat Report: 2026

Observed data · Netskope customer base · 2026

Method and full statement

According to Netskope's Cloud and Threat Report 2026, 47% of genAI users at work use personal AI apps, down from 78% a year earlier.

Method
Telemetry: anonymized usage data collected by the Netskope One platform from Netskope customers
Sample
Netskope customer base (count not stated)
#

59%

of users use AI apps weekly (median org)

Netskope Threat Labs, Netskope AI Report: 2026

Observed data · subset of Netskope customers · 2026

Method and full statement

According to Netskope's AI Report 2026, the share of enterprise users using AI apps weekly rose from 34% to 59% in the median organization over the past year.

Method
Telemetry: aggregate usage data collected by the Netskope One platform for a subset of Netskope customers
Sample
subset of Netskope customers (count not stated)
#

30%

of AI users use only personal AI apps

Netskope Threat Labs, Netskope AI Report: 2026

Observed data · subset of Netskope customers · 2026

Method and full statement

According to Netskope's AI Report 2026, 30% of AI users use only personal AI apps and another 14% mix personal and organization-managed apps.

Method
Telemetry: aggregate usage data collected by the Netskope One platform for a subset of Netskope customers
Sample
subset of Netskope customers (count not stated)
#

32.3%

of workplace ChatGPT use is on personal accounts

Cyberhaven Labs, 2026 AI Adoption & Risk Report

Observed data · 2026

Method and full statement

According to Cyberhaven's 2026 AI Adoption & Risk Report, 32.3% of ChatGPT usage and 24.9% of Gemini usage at work happens through personal accounts.

Method
Telemetry: billions of real-world data movements around GenAI SaaS apps, endpoint AI apps and AI agents observed by Cyberhaven
Sample
not stated (billions of data movements)
#
Show all 25 stats in this section

16.9%

of sensitive AI exposures via personal free accounts

Harmonic Security, What 22 Million Enterprise AI Prompts Reveal About Shadow AI in 2025 (AI Usage Index)

Observed data · 22.4M prompts · 2026

Method and full statement

According to Harmonic Security's analysis of 22.4 million enterprise AI prompts in 2025, 16.9% of all sensitive data exposures flowed through personal free-tier AI accounts where IT has no visibility.

Method
Telemetry: 22,458,240 enterprise GenAI prompts and file uploads across 665 AI tools observed by Harmonic's browser product
Sample
22.4M prompts; 579,113 sensitive data exposures
#

47%

of enterprise AI conversations use personal identities

LayerX Security, State of AI Usage Report 2026

Observed data · 2026

Method and full statement

According to LayerX's State of AI Usage Report 2026, 47% of enterprise AI conversations are done through personal identities rather than corporate accounts.

Method
Telemetry: enterprise browser data from LayerX customers (method details not stated on the report page)
Sample
not stated
#

90%

believe employees use AI in their organization

ISACA, 2026 AI Pulse Poll

Survey · n=3,400+ digital trust professionals · 2026

Method and full statement

According to ISACA's 2026 AI Pulse Poll, 90% of digital trust professionals believe employees are using AI in their organization, but only 22% say AI ROI has met or exceeded expectations.

Method
Global ISACA poll of digital trust professionals in IT audit, governance, cybersecurity, privacy and emerging tech roles
Sample
n=3,400+ digital trust professionals
#

45.4%

of sensitive AI interactions from personal emails

Harmonic Security, The AI Tightrope: Balancing Innovation and Exposure in the Enterprise (Q1 2025)

Observed data · 8,000 enterprise users · 2025

Method and full statement

According to Harmonic Security's Q1 2025 research, 45.4% of sensitive AI interactions came from personal email accounts.

Method
Telemetry: over 176,000 AI prompts and thousands of file uploads from a sample of 8,000 enterprise users
Sample
8,000 enterprise users
#

68%

of enterprise GenAI users use personal accounts

TELUS Digital, AI at Work survey (shadow AI)

Survey · n=1,000 US enterprise employees · 2025

Method and full statement

According to a TELUS Digital survey, nearly 68% of enterprise employees who use GenAI at work access public AI assistants through personal accounts.

Method
Pollfish survey of US adults at companies with 5,000+ employees who had used an AI assistant at work
Sample
n=1,000 US enterprise employees
#

56%

used AI at work without knowing if allowed

University of Melbourne and KPMG, Trust, attitudes and use of Artificial Intelligence: A global study 2025

Survey · n=48,340 people across 47 countries · 2025

Method and full statement

According to the University of Melbourne and KPMG's 2025 global study, 56% of employees say they have used AI tools at work without knowing if it is allowed.

Method
Online survey of nationally representative samples of adults in 47 countries; workplace findings from the employed subsample
Sample
n=48,340 people across 47 countries
#

68%

of security leaders use unauthorized AI daily

UpGuard, State of Shadow AI

Survey · n=542 security leaders · 2025

Method and full statement

According to UpGuard's State of Shadow AI report, 8 out of 10 employees use unauthorized AI tools, and 68% of security leaders admit to incorporating unauthorized AI into their daily workflows.

Method
Two surveys: security leaders via Dynata (companies with 200+ employees in US, Canada, APAC, India) and employees via Prolific (US and UK)
Sample
n=542 security leaders; n=1,020 employees
#

8 in 10

employees use unauthorized AI tools

UpGuard, State of Shadow AI

Survey · n=542 security leaders · 2025

Method and full statement

According to UpGuard's State of Shadow AI report, 8 out of 10 employees worldwide use unauthorized AI tools.

Method
Two surveys: security leaders via Dynata (companies with 200+ employees in US, Canada, APAC, India) and employees via Prolific (US and UK)
Sample
n=542 security leaders; n=1,020 employees
#

32%

of GenAI users keep it secret from their employer

Ivanti, 2025 Technology at Work Report: Reshaping Flexible Work

Survey · 2025

Method and full statement

According to Ivanti's 2025 Technology at Work Report, nearly a third (32%) of employees who use GenAI tools at work keep it a secret from their employer.

Method
Survey of office workers and IT and cybersecurity professionals
Sample
n=6,000+ office workers and 1,200 IT/security professionals
#

42%

of employees use GenAI at work (up from 26%)

Ivanti, 2025 Technology at Work Report: Reshaping Flexible Work

Survey · 2025

Method and full statement

According to Ivanti's 2025 Technology at Work Report, 42% of employees admit to using GenAI at work in 2025, up from 26% in 2024.

Method
Survey of office workers and IT and cybersecurity professionals
Sample
n=6,000+ office workers and 1,200 IT/security professionals
#

90%+

of companies have workers using personal AI tools

MIT NANDA (Project NANDA, MIT Media Lab), The GenAI Divide: State of AI in Business 2025

Survey · 52 organizations interviewed · 2025

Method and full statement

According to MIT NANDA's State of AI in Business 2025 report, only 40% of companies say they purchased an official LLM subscription, yet workers at over 90% of companies surveyed reported regular use of personal AI tools for work.

Method
Multi-method: review of 300+ public AI initiatives, structured interviews with representatives of 52 organizations, survey of 153 senior leaders at four industry conferences
Sample
52 organizations interviewed; 153 leaders surveyed
#

37%

follow company AI policy only 'most of the time'

1Password, 2025 Annual Report: The Access-Trust Gap

Survey · n=5,000+ knowledge workers · 2025

Method and full statement

According to 1Password's 2025 Access-Trust Gap report, 73% of employees are encouraged to use AI at work, but 37% say they follow their company's AI policies only 'most of the time.'

Method
Survey of knowledge workers in 5 countries
Sample
n=5,000+ knowledge workers
#

27%

of AI app spend arrives via individual users (PLG)

Menlo Ventures, 2025: The State of Generative AI in the Enterprise

Survey · ~500 U.S. enterprise decision-makers · 2025

Method and full statement

Menlo Ventures found that 27% of all AI application spend enters companies through product-led growth (individual users), nearly 4x the 7% rate in traditional software, and close to 40% when personal-card shadow AI is counted.

Method
Survey of ~500 U.S. enterprise AI decision-makers combined with a bottoms-up model of the generative AI market (model APIs, infrastructure, applications)
Sample
~500 U.S. enterprise decision-makers
#

75%

of knowledge workers use AI at work

Microsoft and LinkedIn, 2024 Work Trend Index Annual Report

Survey · n=31,000 people in 31 countries · 2024

Method and full statement

According to Microsoft and LinkedIn's 2024 Work Trend Index, 75% of knowledge workers now use AI at work.

Method
Survey of 31,000 knowledge workers across 31 countries, plus LinkedIn labor and hiring trends and Microsoft 365 productivity signals
Sample
n=31,000 people in 31 countries
#

46%

would keep using shadow AI even if banned

Software AG, Shadow AI study (press release)

Survey · n=6,000 knowledge workers · 2024

Method and full statement

According to a Software AG study of 6,000 knowledge workers, half of all employees use shadow AI, and 46% would refuse to stop even if their organization banned it.

Method
Survey of knowledge workers commissioned by Software AG
Sample
n=6,000 knowledge workers
#

50%

of employees use shadow AI

Software AG, Shadow AI study (press release)

Survey · n=6,000 knowledge workers · 2024

Method and full statement

According to a Software AG study, half of all employees are using shadow AI, meaning AI tools not provided by their companies.

Method
Survey of knowledge workers commissioned by Software AG
Sample
n=6,000 knowledge workers
#

Over half

of workplace GenAI users lack employer approval

Salesforce, Generative AI Snapshot Research Series: The Promises and Pitfalls of AI at Work

Survey · n=14,000+ full-time employees · 2023

Method and full statement

According to Salesforce's 2023 Generative AI Snapshot research, 28% of workers use generative AI at work, and over half of them do so without formal approval from their employer.

Method
Double-anonymous survey conducted with YouGov of full-time employees in 14 countries
Sample
n=14,000+ full-time employees
#

What goes into the prompt 19 stats

48%

of employees uploaded sensitive company data to public AI

University of Melbourne and KPMG, Trust, attitudes and use of Artificial Intelligence: A global study 2025

Survey · n=48,340 people across 47 countries · 2025

Method and full statement

According to the University of Melbourne and KPMG's 2025 global study of 48,000 people in 47 countries, about half (48 to 49%) of employees have uploaded sensitive company information or copyrighted material into public AI tools.

Method
Online survey of nationally representative samples of adults in 47 countries; workplace findings from the employed subsample
Sample
n=48,340 people across 47 countries
#

223

genAI data policy violations per org per month

Netskope Threat Labs, Cloud and Threat Report: 2026

Observed data · Netskope customer base · 2026

Method and full statement

According to Netskope's Cloud and Threat Report 2026, the average organization sees 223 incidents per month of users sending sensitive data to genAI apps, double the year before.

Method
Telemetry: anonymized usage data collected by the Netskope One platform from Netskope customers
Sample
Netskope customer base (count not stated)
#

42%

of genAI data violations involve source code

Netskope Threat Labs, Cloud and Threat Report: 2026

Observed data · Netskope customer base · 2026

Method and full statement

According to Netskope's Cloud and Threat Report 2026, source code (42%), regulated data (32%) and intellectual property (16%) were the top data types in genAI data policy violations.

Method
Telemetry: anonymized usage data collected by the Netskope One platform from Netskope customers
Sample
Netskope customer base (count not stated)
#

39.7%

of data movements into AI involve sensitive data

Cyberhaven Labs, 2026 AI Adoption & Risk Report

Observed data · 2026

Method and full statement

According to Cyberhaven's 2026 AI Adoption & Risk Report, 39.7% of all data movements into AI tools involve sensitive data.

Method
Telemetry: billions of real-world data movements around GenAI SaaS apps, endpoint AI apps and AI agents observed by Cyberhaven
Sample
not stated (billions of data movements)
#

Every 3 days

the average employee puts sensitive data into AI

Cyberhaven Labs, 2026 AI Adoption & Risk Report

Observed data · 2026

Method and full statement

According to Cyberhaven's 2026 AI Adoption & Risk Report, the average employee enters sensitive data into AI tools once every three days.

Method
Telemetry: billions of real-world data movements around GenAI SaaS apps, endpoint AI apps and AI agents observed by Cyberhaven
Sample
not stated (billions of data movements)
#

12.8%

of AI coding-tool exposures contain credentials

Harmonic Security, What 22 Million Enterprise AI Prompts Reveal About Shadow AI in 2025 (AI Usage Index)

Observed data · 22.4M prompts · 2026

Method and full statement

According to Harmonic Security, 12.8% of sensitive data exposures in AI coding tools contain API keys, tokens or other credentials.

Method
Telemetry: 22,458,240 enterprise GenAI prompts and file uploads across 665 AI tools observed by Harmonic's browser product
Sample
22.4M prompts; 579,113 sensitive data exposures
#

1 in 12

enterprise ChatGPT conversations contain sensitive data

LayerX Security, State of AI Usage Report 2026

Observed data · 2026

Method and full statement

According to LayerX's State of AI Usage Report 2026, more than 1 in 12 ChatGPT conversations in the enterprise contains sensitive information.

Method
Telemetry: enterprise browser data from LayerX customers (method details not stated on the report page)
Sample
not stated
#

18,033 TB

of enterprise data sent to AI apps in 2025

Zscaler ThreatLabz, ThreatLabz 2026 AI Security Report

Observed data · ~9,000 organizations · 2026

Method and full statement

According to Zscaler's ThreatLabz 2026 AI Security Report, enterprise data transfers to AI/ML applications surged 93% in 2025 to 18,033 terabytes.

Method
Telemetry: 989.3 billion AI/ML transactions generated by about 9,000 organizations on the Zscaler Zero Trust Exchange
Sample
~9,000 organizations
#
Show all 19 stats in this section

410M

DLP violations tied to ChatGPT alone

Zscaler ThreatLabz, ThreatLabz 2026 AI Security Report

Observed data · ~9,000 organizations · 2026

Method and full statement

According to Zscaler's ThreatLabz 2026 AI Security Report, ChatGPT alone was tied to 410 million data loss prevention policy violations in 2025.

Method
Telemetry: 989.3 billion AI/ML transactions generated by about 9,000 organizations on the Zscaler Zero Trust Exchange
Sample
~9,000 organizations
#

34.8%

of data put into AI tools is sensitive

Cyberhaven Labs, 2025 AI Adoption and Risk Report

Observed data · 7 million workers · 2025

Method and full statement

According to Cyberhaven's 2025 AI Adoption and Risk Report, 34.8% of the corporate data employees put into AI tools is sensitive, up from 10.7% two years earlier.

Method
Telemetry: actual AI usage patterns of 7 million workers observed by Cyberhaven's data security platform
Sample
7 million workers
#

83.8%

of enterprise data sent to AI goes to risky tools

Cyberhaven Labs, 2025 AI Adoption and Risk Report

Observed data · 7 million workers · 2025

Method and full statement

According to Cyberhaven's 2025 AI Adoption and Risk Report, 71.7% of AI tools used in workplaces are high or critical risk, and 83.8% of enterprise data going to AI flows to these risky tools.

Method
Telemetry: actual AI usage patterns of 7 million workers observed by Cyberhaven's data security platform
Sample
7 million workers
#

26%

of files uploaded to GenAI contain sensitive data

Harmonic Security, GenAI in the Enterprise: It's Getting Personal (Q3 2025)

Observed data · 3M+ prompts and uploads · 2025

Method and full statement

According to Harmonic Security's Q3 2025 analysis, 26.38% of files uploaded to GenAI tools contained sensitive information, up from 22% in Q2.

Method
Telemetry: anonymized enterprise data from Harmonic Protect covering over three million prompts and file uploads across 300 GenAI and AI-embedded tools, US and UK organizations
Sample
3M+ prompts and uploads
#

40%

of files uploaded to GenAI contain PII or PCI

LayerX Security, Enterprise AI and SaaS Data Security Report 2025

Observed data · 2025

Method and full statement

According to LayerX's Enterprise AI and SaaS Data Security Report 2025, 40% of files uploaded to GenAI tools contain sensitive PII or PCI data.

Method
Telemetry: real-world enterprise browsing data from LayerX's enterprise customers
Sample
not stated
#

32%

of corporate-to-personal data transfers go to GenAI

LayerX Security, Enterprise AI and SaaS Data Security Report 2025

Observed data · 2025

Method and full statement

According to LayerX's Enterprise AI and SaaS Data Security Report 2025, GenAI tools account for 32% of all corporate-to-personal data transfers, making AI the top data exfiltration channel.

Method
Telemetry: real-world enterprise browsing data from LayerX's enterprise customers
Sample
not stated
#

57%

admit entering sensitive data into public AI

TELUS Digital, AI at Work survey (shadow AI)

Survey · n=1,000 US enterprise employees · 2025

Method and full statement

According to a TELUS Digital survey, 57% of enterprise employees who use GenAI at work admit to entering sensitive information into public AI assistants.

Method
Pollfish survey of US adults at companies with 5,000+ employees who had used an AI assistant at work
Sample
n=1,000 US enterprise employees
#

70%

know of sensitive data shared with AI at work

UpGuard, State of Shadow AI

Survey · n=542 security leaders · 2025

Method and full statement

According to UpGuard's State of Shadow AI report, 70% of employees know of sensitive data being shared with AI tools at their workplace.

Method
Two surveys: security leaders via Dynata (companies with 200+ employees in US, Canada, APAC, India) and employees via Prolific (US and UK)
Sample
n=542 security leaders; n=1,020 employees
#

99%

of orgs have sensitive data AI can surface

Varonis, 2025 State of Data Security Report: Quantifying AI's Impact on Data Risk

Observed data · 1,000 organizations' IT environments · 2025

Method and full statement

According to Varonis' 2025 State of Data Security Report, 99% of organizations have exposed sensitive data that can easily be surfaced by AI.

Method
Telemetry: analysis of 1,000 real-world IT environments and nearly 10 billion files across cloud and SaaS
Sample
1,000 organizations' IT environments
#

64%

worry about leaking sensitive data via GenAI

Cisco, 2025 Data Privacy Benchmark Study

Survey · n=2,600 privacy and security professionals · 2025

Method and full statement

According to Cisco's 2025 Data Privacy Benchmark Study, 64% of privacy and security professionals worry about inadvertently sharing sensitive information through GenAI, yet nearly half admit inputting personal employee or non-public data into GenAI tools.

Method
Survey of privacy and security professionals in 12 countries
Sample
n=2,600 privacy and security professionals
#

48%

entered non-public company info into GenAI

Cisco, 2024 Data Privacy Benchmark Study

Survey · n=2,600 privacy and security professionals · 2024

Method and full statement

According to Cisco's 2024 Data Privacy Benchmark Study, 48% of privacy and security professionals admit entering non-public company information into GenAI tools.

Method
Survey of privacy and security professionals across 12 geographies
Sample
n=2,600 privacy and security professionals
#

AI apps multiply faster than reviews 19 stats

Torii data

26 of 50

top shadow IT apps are pure-play AI

Torii, SaaS Benchmark Annual Report 2026

Observed data · 2026

Method and full statement

In 2025, 26 of the top 50 shadow IT apps were pure-play AI tools, according to Torii's 2026 SaaS Benchmark.

Method
Observed: aggregated, anonymized discovery data from environments Torii connects to
Sample
not published
#
Torii data

694

new AI-native apps discovered in 2025

Torii, SaaS Benchmark Annual Report 2026

Observed data · 2026

Method and full statement

Torii discovered 694 new AI-native applications in 2025, more than double the 2023 figure of 317, according to its 2026 SaaS Benchmark.

Method
Observed: aggregated, anonymized discovery data from environments Torii connects to
Sample
not published
#

254

distinct AI apps used by the average company

Harmonic Security, The AI Tightrope: Balancing Innovation and Exposure in the Enterprise (Q1 2025)

Observed data · 8,000 enterprise users · 2025

Method and full statement

According to Harmonic Security's Q1 2025 research, the average company interacted with 254 distinct AI applications, not counting mobile or API access.

Method
Telemetry: over 176,000 AI prompts and thousands of file uploads from a sample of 8,000 enterprise users
Sample
8,000 enterprise users
#
Torii data

11 → 694

new AI-native apps a year, 2020 vs 2025

Torii, SaaS Benchmark Annual Report 2026

Observed data · 2026

Method and full statement

New AI-native apps discovered per year grew from 11 in 2020 to 694 in 2025, according to Torii's 2026 SaaS Benchmark.

Method
Observed: aggregated, anonymized discovery data from environments Torii connects to
Sample
not published
#

6x

growth in prompts sent to genAI apps

Netskope Threat Labs, Cloud and Threat Report: 2026

Observed data · Netskope customer base · 2026

Method and full statement

According to Netskope's Cloud and Threat Report 2026, the amount of data sent to SaaS genAI apps grew sixfold in a year, from 3,000 to 18,000 prompts per month per organization, while user counts tripled.

Method
Telemetry: anonymized usage data collected by the Netskope One platform from Netskope customers
Sample
Netskope customer base (count not stated)
#

1,600+

genAI apps tracked, up fivefold in a year

Netskope Threat Labs, Cloud and Threat Report: 2026

Observed data · Netskope customer base · 2026

Method and full statement

According to Netskope's Cloud and Threat Report 2026, the number of genAI apps it tracks grew fivefold to more than 1,600, while the average organization uses 8 AI apps, up from 6.

Method
Telemetry: anonymized usage data collected by the Netskope One platform from Netskope customers
Sample
Netskope customer base (count not stated)
#

300+

GenAI tools in the top 1% of organizations

Cyberhaven Labs, 2026 AI Adoption & Risk Report

Observed data · 2026

Method and full statement

According to Cyberhaven's 2026 AI Adoption & Risk Report, the top 1% of early-adopter organizations use more than 300 GenAI tools, while cautious enterprises use fewer than 15.

Method
Telemetry: billions of real-world data movements around GenAI SaaS apps, endpoint AI apps and AI agents observed by Cyberhaven
Sample
not stated (billions of data movements)
#
Show all 19 stats in this section

665

AI tools seen in enterprise prompt traffic

Harmonic Security, What 22 Million Enterprise AI Prompts Reveal About Shadow AI in 2025 (AI Usage Index)

Observed data · 22.4M prompts · 2026

Method and full statement

According to Harmonic Security, enterprise employees sent prompts to 665 different AI tools in 2025, but six applications accounted for 92.6% of sensitive data exposure.

Method
Telemetry: 22,458,240 enterprise GenAI prompts and file uploads across 665 AI tools observed by Harmonic's browser product
Sample
22.4M prompts; 579,113 sensitive data exposures
#

75%

of AI browser extensions have high or critical permissions

LayerX Security, State of AI Usage Report 2026

Observed data · 2026

Method and full statement

According to LayerX's State of AI Usage Report 2026, nearly 75% of AI browser extensions are granted high or critical permissions, and 16.31% have known CVEs.

Method
Telemetry: enterprise browser data from LayerX customers (method details not stated on the report page)
Sample
not stated
#

414

unsanctioned AI tools per 1,000 employees

Reco, The State of Agent Security 2026

Observed data · 500 MCP servers · 2026

Method and full statement

According to Reco's State of Agent Security 2026, small and mid-size firms average 414 unsanctioned AI tools per 1,000 employees, even where 79% of SaaS is authorized.

Method
Reco platform telemetry, independent analysis of 500 published npm MCP servers, and the public CVE record
Sample
500 MCP servers; 260+ AI agents and apps in telemetry
#

3,400+

apps generating enterprise AI traffic

Zscaler ThreatLabz, ThreatLabz 2026 AI Security Report

Observed data · ~9,000 organizations · 2026

Method and full statement

According to Zscaler's ThreatLabz 2026 AI Security Report, the number of applications driving AI/ML transactions quadrupled year over year to more than 3,400.

Method
Telemetry: 989.3 billion AI/ML transactions generated by about 9,000 organizations on the Zscaler Zero Trust Exchange
Sample
~9,000 organizations
#

83%

year-over-year growth in enterprise AI activity

Zscaler ThreatLabz, ThreatLabz 2026 AI Security Report

Observed data · ~9,000 organizations · 2026

Method and full statement

According to Zscaler's ThreatLabz 2026 AI Security Report, enterprise AI/ML activity increased 83% year over year in 2025.

Method
Telemetry: 989.3 billion AI/ML transactions generated by about 9,000 organizations on the Zscaler Zero Trust Exchange
Sample
~9,000 organizations
#

61x

growth in workplace AI usage over two years

Cyberhaven Labs, 2025 AI Adoption and Risk Report

Observed data · 7 million workers · 2025

Method and full statement

According to Cyberhaven's 2025 AI Adoption and Risk Report, the frequency of AI use at work grew 4.6x in 12 months and 61x over 24 months.

Method
Telemetry: actual AI usage patterns of 7 million workers observed by Cyberhaven's data security platform
Sample
7 million workers
#

27

distinct AI tools used per organization per quarter

Harmonic Security, GenAI in the Enterprise: It's Getting Personal (Q3 2025)

Observed data · 3M+ prompts and uploads · 2025

Method and full statement

According to Harmonic Security's Q3 2025 analysis, the average organization's employees used 27 distinct AI tools in the quarter.

Method
Telemetry: anonymized enterprise data from Harmonic Protect covering over three million prompts and file uploads across 300 GenAI and AI-embedded tools, US and UK organizations
Sample
3M+ prompts and uploads
#

20%+

of enterprise users have a GenAI browser extension

LayerX Security, Enterprise Browser Extension Security Report 2025

Observed data · tens of thousands of enterprise users · 2025

Method and full statement

According to LayerX's Enterprise Browser Extension Security Report 2025, over 20% of enterprise users have a GenAI-enabled browser extension installed, and 58% of GenAI extensions have high or critical permissions.

Method
Telemetry: real-life usage data from enterprise users in LayerX's customer base combined with public extension store data
Sample
tens of thousands of enterprise users (per release)
#

10.53B

monthly visits to GenAI sites (Jan 2025)

Menlo Security, 2025 Report: How AI is Shaping the Modern Workspace

Observed data · hundreds of global organizations · 2025

Method and full statement

According to Menlo Security's 2025 report, web traffic to GenAI sites jumped 50%, from 7 billion visits in February 2024 to 10.53 billion in January 2025.

Method
Telemetry: browser data from hundreds of global organizations using Menlo Security
Sample
hundreds of global organizations
#

890%

surge in enterprise GenAI traffic in 2024

Palo Alto Networks, The State of Generative AI in 2025

Observed data · 7,000+ enterprises · 2025

Method and full statement

According to Palo Alto Networks' State of Generative AI 2025, GenAI traffic surged more than 890% in 2024.

Method
Telemetry: observations of GenAI traffic across more than 7,000 enterprises
Sample
7,000+ enterprises
#

66

GenAI apps used by the average organization

Palo Alto Networks, The State of Generative AI in 2025

Observed data · 7,000+ enterprises · 2025

Method and full statement

According to Palo Alto Networks' State of Generative AI 2025, organizations used an average of 66 GenAI apps, with 10% classified as high risk.

Method
Telemetry: observations of GenAI traffic across more than 7,000 enterprises
Sample
7,000+ enterprises
#

269

shadow AI tools per 1,000 employees at small firms

Reco, 2025 State of Shadow AI Report

Observed data · 50+ enterprise environments · 2025

Method and full statement

According to Reco's 2025 State of Shadow AI Report, small businesses average 269 shadow AI tools per 1,000 employees, and 27% of employees at companies with 11 to 50 workers use unsanctioned AI tools.

Method
Telemetry: Reco platform monitoring across 50+ enterprise environments and 55,000+ SaaS applications
Sample
50+ enterprise environments
#

Policy hasn't caught up 24 stats

38%

of orgs have a formal, comprehensive AI policy

ISACA, 2026 AI Pulse Poll

Survey · n=3,400+ digital trust professionals · 2026

Method and full statement

According to ISACA's 2026 AI Pulse Poll, only 38% of organizations have a formal, comprehensive AI policy, up from 28% in 2025, and 25% have no active policy.

Method
Global ISACA poll of digital trust professionals in IT audit, governance, cybersecurity, privacy and emerging tech roles
Sample
n=3,400+ digital trust professionals
#

50%

of orgs lack enforceable genAI data policies

Netskope Threat Labs, Cloud and Threat Report: 2026

Observed data · Netskope customer base · 2026

Method and full statement

According to Netskope's Cloud and Threat Report 2026, 50% of organizations lack enforceable data protection policies for genAI apps.

Method
Telemetry: anonymized usage data collected by the Netskope One platform from Netskope customers
Sample
Netskope customer base (count not stated)
#

90%

of orgs block at least one genAI app

Netskope Threat Labs, Cloud and Threat Report: 2026

Observed data · Netskope customer base · 2026

Method and full statement

According to Netskope's Cloud and Threat Report 2026, 90% of organizations actively block at least one genAI app, blocking 10 apps on average.

Method
Telemetry: anonymized usage data collected by the Netskope One platform from Netskope customers
Sample
Netskope customer base (count not stated)
#

56%

don't know how fast they could shut down AI

ISACA, 2026 AI Pulse Poll (preview, RSA Conference)

Survey · n=3,400+ digital trust professionals · 2026

Method and full statement

According to ISACA's 2026 AI Pulse Poll, 56% of digital trust professionals do not know how quickly they could halt an AI system during a security incident.

Method
Global ISACA poll of digital trust professionals
Sample
n=3,400+ digital trust professionals
#

20%

don't know who owns AI harm

ISACA, 2026 AI Pulse Poll (preview, RSA Conference)

Survey · n=3,400+ digital trust professionals · 2026

Method and full statement

According to ISACA's 2026 AI Pulse Poll, 20% of respondents don't know who would be responsible if an AI system caused harm or serious error in their organization.

Method
Global ISACA poll of digital trust professionals
Sample
n=3,400+ digital trust professionals
#

87%

worry about unauthorized employee AI use

ISACA, 2026 AI Pulse Poll (Europe findings)

Survey · n=681 digital trust professionals in Europe · 2026

Method and full statement

According to ISACA's 2026 AI Pulse Poll in Europe, 87% of professionals are concerned about employees using AI in an unauthorized capacity.

Method
ISACA survey of digital trust professionals in Europe
Sample
n=681 digital trust professionals in Europe
#

26%

can actually enforce their AI security strategy

Check Point Software, 2026 Cloud Security Report: Enter the AI Era

Survey · 2026

Method and full statement

According to Check Point's 2026 Cloud Security Report, 77% of organizations have updated their security strategy in response to AI, but only 26% have the architecture to enforce it.

Method
method not stated in the press release
Sample
not stated
#

16%

enforce AI access controls consistently

Check Point Software, 2026 Cloud Security Report: Enter the AI Era

Survey · 2026

Method and full statement

According to Check Point's 2026 Cloud Security Report, 24% of organizations have no AI-specific access controls, and only 16% enforce controls consistently.

Method
method not stated in the press release
Sample
not stated
#
Show all 24 stats in this section

~50%

don't always know when employees use AI tools

Flexera, Flexera 2026 AI Pulse Report

Survey · 2026

Method and full statement

Flexera found nearly half of organizations don't always know how or when employees are using AI tools, and 85% say IT visibility gaps pose a major risk.

Method
method not stated on page (Flexera survey research)
Sample
not stated
#

97%

of AI-breached orgs lacked AI access controls

IBM (research by Ponemon Institute), Cost of a Data Breach Report 2025

Observed data · 600 organizations globally · 2025

Method and full statement

According to IBM's Cost of a Data Breach Report 2025, 97% of organizations that suffered an AI-related breach lacked proper AI access controls.

Method
Ponemon Institute interviews/analysis of real data breaches experienced by organizations globally
Sample
600 organizations globally
#

63%

of breached orgs lack an AI governance policy

IBM (research by Ponemon Institute), Cost of a Data Breach Report 2025

Observed data · 600 organizations globally · 2025

Method and full statement

According to IBM's Cost of a Data Breach Report 2025, 63% of breached organizations either don't have an AI governance policy or are still developing one.

Method
Ponemon Institute interviews/analysis of real data breaches experienced by organizations globally
Sample
600 organizations globally
#

34%

regularly audit for unsanctioned AI

IBM (research by Ponemon Institute), Cost of a Data Breach Report 2025

Observed data · 600 organizations globally · 2025

Method and full statement

According to IBM's Cost of a Data Breach Report 2025, only 34% of organizations with AI governance policies perform regular audits for unsanctioned AI.

Method
Ponemon Institute interviews/analysis of real data breaches experienced by organizations globally
Sample
600 organizations globally
#

37%

have policies to manage AI or detect shadow AI

IBM (research by Ponemon Institute), Cost of a Data Breach Report 2025

Observed data · 600 organizations globally · 2025

Method and full statement

According to IBM's Cost of a Data Breach Report 2025, only 37% of organizations studied have policies to manage AI or detect shadow AI.

Method
Ponemon Institute interviews/analysis of real data breaches experienced by organizations globally
Sample
600 organizations globally
#

24%

say their employer requires AI training

TELUS Digital, AI at Work survey (shadow AI)

Survey · n=1,000 US enterprise employees · 2025

Method and full statement

According to a TELUS Digital survey, only 24% of enterprise employees who use AI assistants say their company requires mandatory AI assistant training.

Method
Pollfish survey of US adults at companies with 5,000+ employees who had used an AI assistant at work
Sample
n=1,000 US enterprise employees
#

69%

of orgs suspect employees use prohibited GenAI

Gartner, Gartner Identifies Critical GenAI Blind Spots That CIOs Must Urgently Address (press release)

Forecast · n=302 cybersecurity leaders · 2025

Method and full statement

According to a Gartner survey of 302 cybersecurity leaders, 69% of organizations suspect or have evidence that employees are using prohibited public GenAI.

Method
Gartner survey of cybersecurity leaders, plus Gartner analyst prediction
Sample
n=302 cybersecurity leaders
#

2 in 5

employees say there's a GenAI policy at work

University of Melbourne and KPMG, Trust, attitudes and use of Artificial Intelligence: A global study 2025

Survey · n=48,340 people across 47 countries · 2025

Method and full statement

According to the University of Melbourne and KPMG's 2025 global study, only two in five employees say their organization has a policy guiding generative AI use.

Method
Online survey of nationally representative samples of adults in 47 countries; workplace findings from the employed subsample
Sample
n=48,340 people across 47 countries
#

67%

upload sensitive data where GenAI is banned

University of Melbourne and KPMG, Trust, attitudes and use of Artificial Intelligence: A global study 2025

Survey · n=48,340 people across 47 countries · 2025

Method and full statement

According to the University of Melbourne and KPMG's 2025 global study, uploading sensitive data to public AI was most common at organizations that had banned generative AI (67%), versus 33% where there was no policy.

Method
Online survey of nationally representative samples of adults in 47 countries; workplace findings from the employed subsample
Sample
n=48,340 people across 47 countries
#

41%

of employees work around blocked AI apps

UpGuard, State of Shadow AI

Survey · n=542 security leaders · 2025

Method and full statement

According to UpGuard's State of Shadow AI report, 41% of employees find a way around blocked AI applications.

Method
Two surveys: security leaders via Dynata (companies with 200+ employees in US, Canada, APAC, India) and employees via Prolific (US and UK)
Sample
n=542 security leaders; n=1,020 employees
#

90%

of IT leaders worry about shadow AI

Komprise, Komprise IT Survey: AI, Data & Enterprise Risk

Survey · n=200 IT leaders · 2025

Method and full statement

According to Komprise's 2025 IT survey, 90% of IT leaders are concerned about shadow AI from a privacy and security standpoint, and 46% are extremely worried.

Method
Survey of IT directors and executives at US enterprises with 1,000+ employees
Sample
n=200 IT leaders
#

22%

say their employer has a clear AI plan

Gallup, AI Use at Work Has Nearly Doubled in Two Years

Survey · 2025

Method and full statement

According to Gallup, 44% of US employees say their organization has begun integrating AI, but only 22% say it has communicated a clear plan or strategy for doing so.

Method
Self-administered web surveys of a random, probability-based sample of US full- and part-time employees in the Gallup Panel, weighted for nonresponse
Sample
not stated on page (Gallup Panel employees)
#

30%

say their employer has AI guidelines or policies

Gallup, AI Use at Work Has Nearly Doubled in Two Years

Survey · 2025

Method and full statement

According to Gallup, only 30% of US employees say their organization has general guidelines or formal policies for using AI at work.

Method
Self-administered web surveys of a random, probability-based sample of US full- and part-time employees in the Gallup Panel, weighted for nonresponse
Sample
not stated on page (Gallup Panel employees)
#

39%

of AI users got AI training from their employer

Microsoft and LinkedIn, 2024 Work Trend Index Annual Report

Survey · n=31,000 people in 31 countries · 2024

Method and full statement

According to Microsoft and LinkedIn's 2024 Work Trend Index, only 39% of AI users have received AI training from their company.

Method
Survey of 31,000 knowledge workers across 31 countries, plus LinkedIn labor and hiring trends and Microsoft 365 productivity signals
Sample
n=31,000 people in 31 countries
#

60%

of leaders say their company lacks an AI plan

Microsoft and LinkedIn, 2024 Work Trend Index Annual Report

Survey · n=31,000 people in 31 countries · 2024

Method and full statement

According to Microsoft and LinkedIn's 2024 Work Trend Index, 60% of leaders say their company lacks a vision and plan to implement AI.

Method
Survey of 31,000 knowledge workers across 31 countries, plus LinkedIn labor and hiring trends and Microsoft 365 productivity signals
Sample
n=31,000 people in 31 countries
#

27%

of organizations banned GenAI at least temporarily

Cisco, 2024 Data Privacy Benchmark Study

Survey · n=2,600 privacy and security professionals · 2024

Method and full statement

According to Cisco's 2024 Data Privacy Benchmark Study, 27% of organizations had banned the use of generative AI, at least temporarily, over privacy and data security risks.

Method
Survey of privacy and security professionals across 12 geographies
Sample
n=2,600 privacy and security professionals
#

When shadow AI turns into a breach 8 stats

1 in 5

breached organizations hit via shadow AI

IBM (research by Ponemon Institute), Cost of a Data Breach Report 2025

Observed data · 600 organizations globally · 2025

Method and full statement

According to IBM's Cost of a Data Breach Report 2025, one in five organizations studied reported a breach due to shadow AI.

Method
Ponemon Institute interviews/analysis of real data breaches experienced by organizations globally
Sample
600 organizations globally
#

$670K

higher breach cost with high shadow AI

IBM (research by Ponemon Institute), Cost of a Data Breach Report 2025

Observed data · 600 organizations globally · 2025

Method and full statement

According to IBM's Cost of a Data Breach Report 2025, organizations with high levels of shadow AI saw an average of $670,000 in higher breach costs.

Method
Ponemon Institute interviews/analysis of real data breaches experienced by organizations globally
Sample
600 organizations globally
#

78%

had confirmed or suspected AI-related incidents

Check Point Software, 2026 Cloud Security Report: Enter the AI Era

Survey · 2026

Method and full statement

According to Check Point's 2026 Cloud Security Report, 78% of organizations reported confirmed or suspected AI-related security incidents over the past year.

Method
method not stated in the press release
Sample
not stated
#

92%

of AI-breached orgs lacked proper access controls

IBM, Cost of a Data Breach Report 2026

Survey · 602 breached organizations · 2026

Method and full statement

92% of organizations that reported an AI-related breach lacked proper AI access controls, according to IBM's 2026 Cost of a Data Breach Report.

Method
Ponemon Institute research (sponsored and analyzed by IBM) on breaches at 602 organizations globally, March 2025 to February 2026
Sample
602 breached organizations (subset reporting AI breaches)
#

13%

of organizations had AI models or apps breached

IBM (research by Ponemon Institute), Cost of a Data Breach Report 2025

Observed data · 600 organizations globally · 2025

Method and full statement

According to IBM's Cost of a Data Breach Report 2025, 13% of organizations reported breaches of AI models or applications.

Method
Ponemon Institute interviews/analysis of real data breaches experienced by organizations globally
Sample
600 organizations globally
#

60%

of AI-related incidents compromised data

IBM (research by Ponemon Institute), Cost of a Data Breach Report 2025

Observed data · 600 organizations globally · 2025

Method and full statement

According to IBM's Cost of a Data Breach Report 2025, 60% of AI-related security incidents led to compromised data.

Method
Ponemon Institute interviews/analysis of real data breaches experienced by organizations globally
Sample
600 organizations globally
#

40%+

of enterprises will have shadow AI incidents by 2030

Gartner, Gartner Identifies Critical GenAI Blind Spots That CIOs Must Urgently Address (press release)

Forecast · n=302 cybersecurity leaders · 2025

Method and full statement

Gartner predicts that by 2030 more than 40% of enterprises will experience security or compliance incidents linked to unauthorized shadow AI.

Method
Gartner survey of cybersecurity leaders, plus Gartner analyst prediction
Sample
n=302 cybersecurity leaders
#

79%

of orgs had negative outcomes from employee GenAI use

Komprise, Komprise IT Survey: AI, Data & Enterprise Risk

Survey · n=200 IT leaders · 2025

Method and full statement

According to Komprise's 2025 IT survey, nearly 80% of IT leaders say their organization has experienced negative outcomes from employee use of generative AI, including 44% citing sensitive data leaking into AI.

Method
Survey of IT directors and executives at US enterprises with 1,000+ employees
Sample
n=200 IT leaders
#

Spend & pricing · 47 stats

SaaS spend and pricing statistics

SaaS prices keep climbing, and more contracts now bill on usage instead of seats.

Price-hike trackerRecent list-price increases from the biggest SaaS vendorsEach line links to the vendor announcement or the press report of it.

What software costs 17 stats

$9,100

SaaS cost per employee (end of 2025)

Vertice, SaaS Inflation Index 2026

Observed data · 2026

Method and full statement

According to Vertice, SaaS costs per employee reached about $9,100 by the end of 2025, up from $8,700 in 2024 and $7,900 in 2023.

Method
Vertice purchasing and pricing data (method not detailed on page)
Sample
not stated on page
#

1 in 8

dollars of company spend go to SaaS

Vertice, SaaS Inflation Index 2026

Observed data · 2026

Method and full statement

One dollar in every eight a typical organization spends now goes to SaaS, according to Vertice's SaaS Inflation Index 2026.

Method
Vertice purchasing data (method not detailed on page)
Sample
not stated on page
#

74%

of software spend goes to the top 10 vendors

Tropic, The State of Software Procurement in 2026

Observed data · $23B+ tracked spend · 2026

Method and full statement

A company's top 10 software vendors account for roughly 74% of its tracked software spend, a share that hasn't moved in three years, according to Tropic.

Method
Transaction data: negotiated outcomes across $23B+ in tracked spend, 100,000+ negotiations, 30,000+ SKUs across 14,000+ suppliers (Tropic customers)
Sample
$23B+ tracked spend
#

58%

YoY software spend growth, mid-market/enterprise

Tropic, 2026 Software and AI Pricing Trends

Observed data · $18B+ spend under management · 2026

Method and full statement

Mid-market and enterprise companies grew software spend nearly 58% year over year, and SMB/growth companies 50%, according to Tropic.

Method
Transaction data: analysis of $18B+ in spend under management across Tropic customers; cohorts SMB/Growth (1-250 employees) and Mid-Market/Enterprise (251+)
Sample
$18B+ spend under management
#

$234B

of app software spend at risk from AI agents by 2030

Gartner (reported by CIO), Gartner press release, July 1, 2026

Forecast · 2026

Method and full statement

Gartner estimates up to $234 billion in enterprise application software spending, about 20% of enterprise SaaS spend, is at risk from AI agents by 2030.

Method
Analyst forecast
Sample
n/a
#
Show all 17 stats in this section

12.5%

of total organizational spend goes to software

Vertice, Key SaaS inflation stats: How to mitigate in 2025

Observed data · 16,000+ vendors · 2025

Method and full statement

Software accounts for an average of 12.5% of total organizational spending, according to Vertice.

Method
Vertice purchasing and pricing data on 16,000+ vendors (method not detailed)
Sample
16,000+ vendors
#

10%

rise in software spending in 2024

Tropic, 2025 Software Buying Trends for Effective Spend Management

Observed data · $11B spend · 2025

Method and full statement

Software spending rose 10% in 2024 as vendors added AI features that raised costs, according to Tropic's analysis of $11B in corporate spend.

Method
Transaction data: analysis of $11B in corporate technology spending across 500+ Tropic customers
Sample
$11B spend; 500+ customers
#

$21M

average annual software spend, 1,000-10,000 employees

Tropic, 2025 Software Buying Trends for Effective Spend Management

Observed data · $11B spend · 2025

Method and full statement

Companies with 1,000 to 10,000 employees spend an average of $21 million a year on software, against $1.9 million for small businesses, according to Tropic.

Method
Transaction data: analysis of $11B in corporate technology spending across 500+ Tropic customers
Sample
$11B spend; 500+ customers
#

$14,000

software spend per employee, mid-market

Tropic, 2025 Software Buying Trends (blog summary)

Observed data · $11B spend · 2025

Method and full statement

Mid-market companies spend about $14,000 per employee on software, more than enterprises ($9,000), while growth-stage companies spend the most at $17,000, according to Tropic.

Method
Transaction data: analysis of $11B in corporate technology spending across 500+ Tropic customers
Sample
$11B spend; 500+ customers
#

29% → 41%

of IT budget on cloud, SaaS and GenAI

Capgemini Research Institute, On-Demand Tech (FinOps) report

Survey · n=1,000 executives · 2025

Method and full statement

The share of IT budgets going to on-demand technology (cloud, SaaS and GenAI) is expected to rise from 29% to 41% within a year, according to Capgemini.

Method
Survey of 1,000 executives at organizations with $1B+ annual revenue using cloud, SaaS and GenAI, across 12 sectors and 14 countries; fielded May 2025
Sample
n=1,000 executives
#

73%

say SaaS and cloud costs have risen

Flexera, Flexera IT Priorities Report (2026 strategy)

Survey · n=834 IT decision-makers · 2025

Method and full statement

73% of IT leaders say their SaaS and cloud infrastructure costs have risen, according to Flexera's 2026 IT Priorities report.

Method
Survey of global IT decision-makers
Sample
n=834 IT decision-makers
#

$8,000

software spend per employee at startups (0-20 staff)

Cledara, The 2025 Software Spend Report

Observed data · 200+ companies surveyed · 2024

Method and full statement

Startups with up to 20 staff spend about $8,000 per employee on software, while companies with 100-200 staff spend $1,741, according to Cledara.

Method
Cledara transaction data (1M+ transactions with 5,000+ vendors) plus a survey of 200+ tech companies with fewer than 200 staff in the US, UK and EU
Sample
200+ companies surveyed; 1M+ transactions
#

$121,336

annual software spend, companies with 0-20 staff

Cledara, The 2025 Software Spend Report

Observed data · 200+ companies surveyed · 2024

Method and full statement

Even the smallest companies (0-20 employees) spend an average of $121,336 a year on software, according to Cledara.

Method
Cledara transaction data (1M+ transactions with 5,000+ vendors) plus a survey of 200+ tech companies with fewer than 200 staff in the US, UK and EU
Sample
200+ companies surveyed; 1M+ transactions
#

Prices only go one way 19 stats

16.4%

SaaS inflation in June 2026, a record high

Vertice, SaaS Inflation Rate (SaaS Inflation Index)

Observed data · $75bn+ processed spend · 2026

Method and full statement

SaaS prices rose at a record 16.4% annual rate in June 2026, almost 4x US consumer inflation, according to Vertice's SaaS Inflation Index.

Method
Transaction data: over $75bn of global processed spend managed by Vertice in 2026; 2M+ pricing points from 250,000+ contracts
Sample
$75bn+ processed spend; 250,000+ contracts
#

60%

of SaaS vendors mask price rises

Vertice, SaaS Inflation Index 2026

Observed data · 2026

Method and full statement

60% of SaaS vendors deliberately mask their price increases, according to Vertice.

Method
Vertice vendor pricing data (method not detailed on page)
Sample
not stated on page
#

20-37%

AI-linked renewal uplift asks (vs 3-9% typical)

Tropic, The State of Software Procurement in 2026

Observed data · 100,000+ negotiations · 2026

Method and full statement

Software vendors are opening renewal talks with AI-linked price increases of 20-37%, against a typical 3-9% SaaS uplift, according to Tropic's 2026 data.

Method
Transaction data: negotiated outcomes across $23B+ in tracked spend, 100,000+ negotiations, 30,000+ SKUs across 14,000+ suppliers (Tropic customers)
Sample
100,000+ negotiations
#

9%

of IT budget set aside for price increases

Gartner (reported by CIO Dive), Gartner GenAI spending forecast briefing

Forecast · 2025

Method and full statement

CIOs are setting aside 9% of their IT budgets just to cover price increases on existing services, according to Gartner research reported by CIO Dive.

Method
Gartner research (CIO survey); details not stated in article
Sample
not stated
#

+4.3 pts

SaaS inflation rise in two months

Vertice, SaaS Inflation Rate (SaaS Inflation Index)

Observed data · $75bn+ processed spend · 2026

Method and full statement

SaaS inflation jumped 4.3 percentage points in two months in spring 2026, the fastest increase Vertice has recorded.

Method
Transaction data: over $75bn of global processed spend managed by Vertice in 2026; 2M+ pricing points from 250,000+ contracts
Sample
$75bn+ processed spend
#

27%

of SaaS vendors use shrinkflation

Vertice, SaaS shrinkflation (Insights Hub)

Observed data · $75bn+ processed spend · 2026

Method and full statement

27% of SaaS vendors use 'shrinkflation', cutting features or service levels while holding or raising prices, according to Vertice.

Method
Transaction data: over $75bn of global processed spend managed by Vertice in 2026; 2M+ pricing points from 250,000+ contracts
Sample
$75bn+ processed spend
#

8-12%

typical annual SaaS vendor price increase

Cledara, SaaS Renewal Benchmarks 2026

Observed data · 2026

Method and full statement

SaaS vendors are raising prices 8% to 12% a year, with aggressive vendors hitting 15% to 25%, according to Cledara's renewal benchmarks.

Method
Platform data from Cledara's SaaS management platform (method for this figure not detailed)
Sample
not stated
#

11.4%

SaaS price increase, Jan 2024 to Jan 2025

Vertice, SaaS Inflation Stats: How to Mitigate in 2025

Observed data · 16,000+ vendors · 2025

Method and full statement

As of January 2025, SaaS prices were up 11.4% year over year, against 2.7% average inflation across G7 countries, according to Vertice.

Method
Vertice SaaS Inflation Index; pricing and discount data for 16,000+ vendors
Sample
16,000+ vendors
#
Show all 19 stats in this section

33%

of vendors can raise prices at renewal by contract

Vertice, SaaS Inflation Stats: How to Mitigate in 2025

Observed data · 16,000+ vendors · 2025

Method and full statement

Vertice found that 33% of software vendors include contract wording that allows them to raise prices at renewal.

Method
Vertice contract data; pricing and discount data for 16,000+ vendors
Sample
16,000+ vendors
#

6%

Salesforce average list price increase, Aug 2025

Salesforce, Salesforce pricing update announcement

Vendor or analysis · 2025

Method and full statement

Salesforce raised list prices by an average of 6% on August 1, 2025 for Enterprise and Unlimited Editions of Sales Cloud, Service Cloud, Field Service and select Industries Clouds.

Method
Official vendor price announcement
Sample
not applicable
#

up to 10%

Atlassian cloud price increase, Oct 2025

Atlassian Investor Relations, Notice of FY26 Cloud Pricing Changes from Atlassian

Vendor or analysis · 2025

Method and full statement

Atlassian raised cloud list prices on October 15, 2025: 5% for Standard, 7.5% for Premium and 7.5% to 10% for Enterprise editions of Jira, Confluence and Jira Service Management, with Bitbucket up 10%.

Method
Official vendor price notice
Sample
not applicable
#

37%

of software vendors plan to reprice for AI

ICONIQ, 2025 State of AI: The Builder's Playbook

Survey · n=300 software-company executives · 2025

Method and full statement

ICONIQ found that while many software companies include AI features for free today, 37% plan to change their pricing in the next year to reflect AI value and usage.

Method
Survey of executives at software companies plus interviews with AI leaders in the ICONIQ community
Sample
n=300 software-company executives
#

+8%

Microsoft 365 E3 list price increase (July 2026)

Microsoft, Microsoft 365 packaging and pricing updates (effective July 1, 2026)

Vendor or analysis · n/a · 2025

Method and full statement

Microsoft is raising Microsoft 365 E3 from $36 to $39 per user per month (8%) and Office 365 E3 from $23 to $26 (13%) on July 1, 2026, alongside new AI capabilities in the suites.

Method
Vendor list-price announcement
Sample
n/a (list prices)
#

73%

of software vendors raised prices in 2023

Vertice, SaaS Inflation Index (press release)

Observed data · 16,000 software vendors · 2023

Method and full statement

Vertice's SaaS Inflation Index found that 73% of software vendors raised their prices in 2023, and SaaS inflation ran at 8.7%, more than double US CPI.

Method
Price index from purchasing data on 16,000 software vendors
Sample
16,000 software vendors
#

From seats to consumption 11 stats

37.6%

monthly budget variance on consumption-priced tools

Vertice, Vertice Insights: Budget variance rates - consumption vs seat pricing

Observed data · Vertice customers · 2026

Method and full statement

Consumption-priced SaaS tools show a 37.6% average monthly budget variance, versus 4.1% for seat-based tools, according to Vertice.

Method
Contract and spend data: over $75bn of global processed spend managed by Vertice in 2026
Sample
Vertice customers; $75bn+ processed spend
#

36.5%

of SaaS contracts now priced per usage

Vertice, Vertice Insights: SaaS pricing models

Observed data · Vertice customers · 2026

Method and full statement

Per-usage pricing became the single most common SaaS pricing model in Q2 2026 at 36.5% of contracts, overtaking per-user pricing at 32.4%, according to Vertice.

Method
Contract data: over $75bn of global processed spend managed by Vertice in 2026
Sample
Vertice customers; $75bn+ processed spend
#

1 in 3+

AI tools billed purely on usage or tokens

BetterCloud, 2026 State of SaaS

Survey · n=525 · 2026

Method and full statement

More than a third of the AI tools in today's tech stacks are billed only on usage or token consumption, not per seat, according to BetterCloud.

Method
Survey of 525 IT and security professionals at SaaS-first organizations
Sample
n=525
#

22.6%

cost increase, seat to consumption pricing switch

Vertice, Vertice Insights: Consumption pricing - contract cost changes

Observed data · Vertice customers · 2026

Method and full statement

When a SaaS vendor moves a customer from seat-based to consumption pricing, contract costs rise 22.6% on average, according to Vertice.

Method
Contract data: over $75bn of global processed spend managed by Vertice in 2026
Sample
Vertice customers; $75bn+ processed spend
#

37%

higher cost per user under consumption pricing

Vertice, Vertice Insights: Consumption pricing - cost-per-user vs seat-based

Observed data · Vertice customers · 2026

Method and full statement

Pure consumption pricing drives the effective cost per user up by as much as 37%, and hybrid models by 21% on average, compared with seat-based pricing, Vertice reports.

Method
Contract data: over $75bn of global processed spend managed by Vertice in 2026
Sample
Vertice customers; $75bn+ processed spend
#

82%

expect per-seat SaaS pricing to fade within five years

EY US, EY US AI Pulse Survey (fifth wave)

Survey · n=534 · 2026

Method and full statement

82% of senior leaders at organizations investing in AI expect traditional per-seat SaaS pricing to become less relevant in their industry within five years, according to EY's US AI Pulse Survey.

Method
Online survey of US-employed decision-makers (SVP+) across sectors, commissioned by EY
Sample
n=534
#

85%

of software companies use usage-based pricing

Metronome, State of Usage-Based Pricing 2025

Survey · n=100 SaaS companies · 2025

Method and full statement

A January 2025 survey of 100 SaaS companies by Metronome and Greyhound Capital found 85% have adopted usage-based pricing.

Method
Survey of SaaS companies by Metronome and Greyhound Capital, across application, vertical and infrastructure SaaS, <$20M to >$100M ARR
Sample
n=100 SaaS companies
#

78%

adopted usage-based pricing in last 5 years

Metronome, State of Usage-Based Pricing 2025

Survey · n=100 SaaS companies · 2025

Method and full statement

78% of software companies with usage-based pricing adopted it within the last five years, and nearly half within the last two, Metronome found.

Method
Survey of SaaS companies by Metronome and Greyhound Capital
Sample
n=100 SaaS companies
#
Show all 11 stats in this section

41%

of software companies now use hybrid pricing

Growth Unhinged (Kyle Poyar), 2025 State of B2B Monetization

Survey · n=240+ software companies · 2025

Method and full statement

Hybrid pricing rose from 27% to 41% of software companies in a year while pure seat-based pricing fell from 21% to 15%, according to Growth Unhinged's 2025 State of B2B Monetization survey.

Method
Survey of software companies, typical respondent $1-20M ARR, US-headquartered
Sample
n=240+ software companies
#

25%

expect outcome-based pricing by 2028

Growth Unhinged (Kyle Poyar), 2025 State of B2B Monetization

Survey · n=240+ software companies · 2025

Method and full statement

Only 5% of software companies use outcome-based pricing as their primary model today, but 25% expect to by 2028, per Growth Unhinged's 2025 State of B2B Monetization survey.

Method
Survey of software companies, typical respondent $1-20M ARR, US-headquartered
Sample
n=240+ software companies
#

3 in 4

software companies changed pricing last year

Growth Unhinged (Kyle Poyar), 2025 State of B2B Monetization

Survey · n=240+ software companies · 2025

Method and full statement

Three in four software companies changed their pricing in the past year, according to Growth Unhinged's 2025 State of B2B Monetization survey.

Method
Survey of software companies, typical respondent $1-20M ARR, US-headquartered
Sample
n=240+ software companies
#

Waste & renewals · 53 stats

License waste and renewals statistics

Many licenses sit idle, and most contracts renew without anyone taking a second look.

Torii dataThe most overbought appsLicense non-utilization rate. The report does not state a time window.
  • Salesforce55%
  • PagerDuty45%
  • monday.com40%
  • Iru39%
  • Zendesk35%
  • 1Password33%
  • Zoom32%
  • Adobe30%
  • Atlassian28%
  • DocuSign27%
  • Calendly25%
  • Slack24%

Source: Torii, SaaS Benchmark Annual Report 2026, "License Utilization Audit" chart.

See the full chart in the benchmark report
Torii dataThe living dead: seats idle for 90+ daysShare of active licenses with no activity in over 90 days.
  • Crunchbase62.1%
  • Seamless.ai56.4%
  • MapBox54.7%
  • UserVoice51.0%
  • Owler50.8%
  • Mailchimp50.6%
  • 6sense48.1%
  • Vendr46.9%
  • AON Radford46.4%
  • Helm45.7%
  • Frontend Masters44.1%
  • Nightfall43.3%

Source: Torii, SaaS Benchmark Annual Report 2026, "Account Decay by Application" chart.

See the full chart in the benchmark report

Licenses nobody uses 23 stats

65%

of SaaS licenses unused or underutilized

Vertice, Vertice Insights: Unused SaaS applications

Observed data · Vertice customers · 2026

Method and full statement

According to Vertice, 65% of all SaaS licenses were either entirely unused or underutilized as of Q2 2026, up from 62% a year earlier.

Method
Telemetry/platform data: insights derived from over $75bn of global processed spend managed by Vertice in 2026
Sample
Vertice customers; $75bn+ processed spend
#
Torii data

55%

of Salesforce licenses go unused

Torii, SaaS Benchmark Annual Report 2026

Observed data · 2026

Method and full statement

Salesforce tops Torii's License Utilization Audit with a 55% non-utilization rate, followed by PagerDuty (45%) and monday.com (40%), according to Torii's 2026 SaaS Benchmark.

Method
Observed: aggregated, anonymized discovery data from environments Torii connects to
Sample
not published
#
Torii data

62.1%

of Crunchbase licenses idle 90+ days

Torii, SaaS Benchmark Annual Report 2026

Observed data · 2026

Method and full statement

62.1% of active Crunchbase licenses had no activity in over 90 days, the highest account decay rate in Torii's 2026 SaaS Benchmark.

Method
Observed: aggregated, anonymized discovery data from environments Torii connects to
Sample
not published
#

14%

of SaaS licenses completely unused

Vertice, Vertice Insights: Unused SaaS applications

Observed data · Vertice customers · 2026

Method and full statement

As of Q2 2026, Vertice's spend data shows 14% of SaaS licenses are fully unused and a further 51% are underutilized (under half of purchased seats in use), so over half of all licenses sit in the underused bucket.

Method
Telemetry/platform data: over $75bn of global processed spend managed by Vertice in 2026
Sample
Vertice customers; $75bn+ processed spend
#

$18.9M

wasted yearly on unused software per large enterprise

Vertice, Vertice Insights: Wasted SaaS spend

Observed data · Vertice customers · 2026

Method and full statement

Vertice estimates that enterprises with 10,000+ employees waste $18.9M a year on unused and underutilized software, roughly 10 times what a 1,000 to 2,500-employee company wastes.

Method
Telemetry/platform data: over $75bn of global processed spend managed by Vertice in 2026
Sample
Vertice customers; $75bn+ processed spend
#

$1.75M

yearly SaaS waste at 500-1,000 employee companies

Vertice, Vertice Insights: Wasted SaaS spend

Observed data · Vertice customers · 2026

Method and full statement

Vertice found that wasted software spend ranges from $1.75M a year at companies with 500 to 1,000 employees up to $18.9M at enterprises with 10,000+ employees.

Method
Telemetry/platform data: over $75bn of global processed spend managed by Vertice in 2026
Sample
Vertice customers; $75bn+ processed spend
#

29%

of cloud spend estimated wasted

Flexera, 2026 State of the Cloud Report

Survey · n=753 · 2026

Method and full statement

Estimated wasted cloud spend rose to 29% in 2026, the first increase in five years, driven by AI workloads, according to Flexera's 2026 State of the Cloud Report.

Method
Survey of cloud decision-makers and users
Sample
n=753
#
Show all 23 stats in this section

25%

SaaS overspend without centralized management

Gartner (via USU reprint), 2026 Gartner Magic Quadrant for SaaS Management Platforms

Forecast · 2026

Method and full statement

Gartner predicts that through 2028, organizations that fail to attain centralized visibility and coordinate SaaS life cycles will overspend on SaaS by at least 25%, due to unused entitlements and overlapping tools.

Method
Analyst forecast (strategic planning assumption)
Sample
not applicable
#

52%

of large organizations overspent on SaaS

Capgemini Research Institute, On-Demand Tech (FinOps) report

Survey · n=1,000 executives · 2025

Method and full statement

52% of large organizations overspent their SaaS budgets, according to Capgemini Research Institute.

Method
Survey of 1,000 executives at organizations with $1B+ annual revenue using cloud, SaaS and GenAI, across 12 sectors and 14 countries; fielded May 2025
Sample
n=1,000 executives
#

$1 in $5

of software spend wasted to complexity

Freshworks, The Cost of Complexity Report

Survey · n=706 · 2025

Method and full statement

Companies waste $1 of every $5 spent on software to failed implementations, underused tools and unexpected costs, according to Freshworks' 2025 Cost of Complexity report.

Method
Survey of 706 practitioners and decision-makers in IT, CX, finance and operations across the US, UK, India, France, Germany and Australia, plus 25 qualitative interviews
Sample
n=706
#

35%

say SaaS waste increased over the past year

Flexera, 2025 State of ITAM Report

Survey · n=506 IT professionals · 2025

Method and full statement

35% of IT asset management professionals say SaaS waste increased over the past year, according to Flexera's 2025 State of ITAM Report.

Method
Survey of global IT professionals across industries
Sample
n=506 IT professionals
#

31%

of organizations don't track unused software licenses

Ivanti, 2025 Technology at Work Report

Survey · 2025

Method and full statement

Nearly one in three IT professionals (31%) say their organizations do not track unused or underused software licenses, according to Ivanti's 2025 Technology at Work report.

Method
Survey of office workers and IT/cybersecurity professionals (Ravn Research)
Sample
1,200 IT and cybersecurity professionals + 6,000+ office workers
#

58%

of IT pros say wasteful IT spend is a problem

Ivanti, 2025 Technology at Work Report

Survey · 1,200 IT and cybersecurity professionals · 2025

Method and full statement

58% of IT professionals say wasteful IT spending is a problem in their organization, and 21% call it a major problem, according to Ivanti.

Method
Survey (Ravn Research)
Sample
1,200 IT and cybersecurity professionals
#

17%

of midsize IT leaders waste half or more of software/SaaS budget

Block 64, Block 64 Market Survey

Survey · n=250 · 2025

Method and full statement

33% of midsized-enterprise IT leaders estimate they waste 10% of their IT budget on underused software and SaaS licenses, 46% say 25%, and 17% say half or more, according to a Block 64 survey.

Method
Survey of midsized enterprise IT leaders across North America
Sample
n=250
#

$135K+

wasted on unused licenses per company

BetterCloud, State of SaaSOps 2024

Survey · 2024

Method and full statement

Companies waste more than $135,000 a year on unused software licenses on average, according to BetterCloud.

Method
Annual survey of IT professionals (sample size not stated in release)
Sample
not stated
#

45%

believe they overspend on software

Cledara, The 2025 Software Spend Report

Survey · n=200+ · 2024

Method and full statement

45% of companies believe they are overspending on software, according to Cledara's 2025 Software Spend Report.

Method
Survey of 200+ tech companies with fewer than 200 staff (US, UK, EU)
Sample
n=200+
#

48%

of software spend wasted at 200+ staff companies

Cledara, The 2025 Software Spend Report

Observed data · 2024

Method and full statement

Companies with more than 200 staff waste 48% of their software spend, according to Cledara.

Method
Cledara transaction data (1M+ transactions with 5,000+ vendors) plus a survey of 200+ tech companies with fewer than 200 staff in the US, UK and EU
Sample
not stated for this cut
#

20%

of SaaS spend self-estimated as wasted

Flexera, 2024 State of ITAM Report

Survey · n=503 · 2024

Method and full statement

Even advanced IT asset management practitioners self-estimate that 20% of SaaS spend is wasted, alongside 30% of desktop software spend, according to Flexera's 2024 State of ITAM Report.

Method
Survey of professionals in organizations with 1,000+ employees who manage or participate in ITAM, SAM and HAM processes
Sample
n=503
#

20-25%

estimated overspend across cloud, software, SaaS and hardware

Flexera, 2025 IT Priorities Report

Survey · 2024

Method and full statement

IT leaders estimate they overspend by around 20-25% across cloud, software, SaaS and hardware, according to Flexera's 2025 IT Priorities Report.

Method
Annual survey of IT leaders; self-estimate
Sample
not stated
#

32%

of SaaS spend underutilized or wasted

Flexera, 2023 State of ITAM Report

Survey · n=500 · 2023

Method and full statement

Respondents to Flexera's 2023 State of ITAM Report estimated 32% of SaaS spend was underutilized or wasted.

Method
Survey of global professionals in organizations with at least 1,000 employees
Sample
n=500
#

49.96%

of installed software unused by employees

Nexthink, Soft-WASTE: How Much Does IT Waste on Unused Software Licenses?

Observed data · 6M+ environments · 2023

Method and full statement

Nexthink found that half (49.96%) of all installed software went unused by employees, costing businesses about $45M per month across 30+ popular tools.

Method
Telemetry: endpoint data from more than 6 million customer environments across 8 industries and 12 regions; cost modeled on 30+ tools at $8-$83 per user per month
Sample
6M+ environments
#

35%

regret software that cost more than expected

Capterra (Gartner Digital Markets), 2024 U.S. Tech Trends Report

Survey · n=700 US respondents · 2023

Method and full statement

The number-one product-related reason for software purchase regret is the software being more expensive than expected, cited by 35% of regretful US buyers, according to Capterra.

Method
Online survey of software purchase decision-makers at businesses with 5+ employees
Sample
n=700 US respondents (of 3,484 global)
#

Renewals on autopilot 12 stats

72.3%

of SaaS contracts auto-renew

Vertice, Vertice Insights: Contracts containing auto-renewal clauses by category

Observed data · Vertice customers · 2026

Method and full statement

As of Q2 2026, 72.3% of SaaS contracts auto-renew on average, up from 60.6% one quarter earlier, according to Vertice.

Method
Contract data: over $75bn of global processed spend managed by Vertice in 2026
Sample
Vertice customers; $75bn+ processed spend
#

72%

of tail-spend contracts renew with no review

Vertice, Vertice Insights: Renewals triggered without review

Observed data · Vertice customers · 2026

Method and full statement

In Q2 2026, 72% of tail-spend software contracts renewed without any review, compared with 14.1% of larger contracts, according to Vertice.

Method
Contract data: over $75bn of global processed spend managed by Vertice in 2026
Sample
Vertice customers; $75bn+ processed spend
#

23.3%

more saved by negotiating 120+ days early

Vertice, Vertice Insights: Renewal savings vs. negotiation time

Observed data · Vertice customers · 2026

Method and full statement

Organizations that begin negotiating 120+ days before a SaaS contract expires save an average of 23.3% more than those who wait until the final month, according to Vertice.

Method
Negotiation outcome data: over $75bn of global processed spend managed by Vertice in 2026
Sample
Vertice customers; $75bn+ processed spend
#

40%

still track SaaS renewals manually

BetterCloud, 2025 State of SaaS

Survey · n≈600 · 2025

Method and full statement

40% of organizations still track SaaS renewals manually, according to BetterCloud's 2025 State of SaaS report.

Method
Survey of about 600 IT professionals
Sample
n≈600
#

39%

savings when renewal prep starts 6 months out

Tropic, The State of Software Procurement in 2026

Observed data · 100,000+ negotiations · 2026

Method and full statement

Companies that start renewal prep six months out save up to 39% on average, compared with 14% at 30 days, according to Tropic.

Method
Transaction data: negotiated outcomes across $23B+ in tracked spend, 100,000+ negotiations, 30,000+ SKUs across 14,000+ suppliers (Tropic customers)
Sample
100,000+ negotiations
#

96.1%

of CRM contracts auto-renew

Vertice, Vertice Insights: Contracts containing auto-renewal clauses by category

Observed data · Vertice customers · 2026

Method and full statement

Vertice data shows 96.1% of CRM contracts now auto-renew, the highest of any software category.

Method
Contract data: over $75bn of global processed spend managed by Vertice in 2026
Sample
Vertice customers; $75bn+ processed spend
#

31.9%

average discount on short-term contracts

Tropic, 2026 Software and AI Pricing Trends Report

Observed data · Tropic customers · 2026

Method and full statement

Tropic found the deepest software discounts came from short-term contracts (31.9%), while 12 to 24-month deals averaged 26.3%.

Method
Analysis of Tropic's procurement data, over $18B in spend under management
Sample
Tropic customers; $18B+ spend under management
#

49%

savings when negotiating 90 days before renewal

Cledara, SaaS Renewal Benchmarks 2026

Observed data · 2026

Method and full statement

Cledara found that companies starting renewal negotiations 90 days ahead achieved average savings of 49%, compared with 19% when they started 30 to 90 days out.

Method
Platform data from Cledara's SaaS management platform across thousands of subscriptions
Sample
not stated (thousands of subscriptions)
#
Show all 12 stats in this section

45%

say price hikes are their top renewal frustration

Spendflo, State of SaaS Procurement 2025

Survey · 2025

Method and full statement

45% of leaders name price hikes as their top frustration at SaaS renewal time, and 30% say they miss contract alerts and get auto-renewed, according to Spendflo.

Method
method not stated (survey of finance/procurement leaders implied)
Sample
not stated
#

14.2 months

average software contract length

Tropic, 2025 Software Buying Trends

Observed data · 500+ customers · 2025

Method and full statement

The average software contract length rose to 14.2 months in 2024, a 6% increase from the year before, according to Tropic.

Method
Analysis of $11B in corporate technology spending from Tropic's platform
Sample
500+ customers; $11B managed spend
#

200-600

software renewals handled per company each year

Tropic, Tropic product press release (Purchase Prep Assistant)

Vendor or analysis · 2025

Method and full statement

Tropic says the average company handles between 200 and 600 software renewals a year, more than one every business day in most cases.

Method
Method not stated (presumably Tropic platform data)
Sample
not stated
#

18%

of renewals signed as multi-year deals

Vendr, The SaaS Trends Report Q3 2023

Observed data · >$3B processed spend · 2023

Method and full statement

Multi-year commitments made up just 18% of software renewal transactions on Vendr's platform in 2023, as multi-year renewals fell 28% compared with 2021, according to Vendr.

Method
Transaction data: more than $3B of software spend processed by Vendr
Sample
>$3B processed spend
#

What negotiation is worth 10 stats

33.8%

average negotiated discount off list price

Vertice, Vertice Insights: Average discount from list price

Observed data · Vertice customers · 2026

Method and full statement

Companies using pricing benchmarks secured an average discount of 33.8% off list price on SaaS contracts, according to Vertice.

Method
Contract data: over $75bn of global processed spend managed by Vertice in 2026
Sample
Vertice customers; $75bn+ processed spend
#

3x

price gap between worst and best deals

Vertice, Vertice Insights: SaaS benchmark prices deviation

Observed data · Vertice customers · 2026

Method and full statement

Vertice's benchmarks show a poorly negotiated deal in categories like CRM, ERP and project management can cost up to three times what a well-negotiated one does for comparable software.

Method
Pricing benchmark data: over $75bn of global processed spend managed by Vertice in 2026
Sample
Vertice customers; $75bn+ processed spend
#

~12%

average final AI uplift after negotiation

Tropic, 2026 Software and AI Pricing Trends Report

Observed data · Tropic customers · 2026

Method and full statement

Negotiation cut AI-driven renewal price asks by about 55% on average, but final uplifts still averaged around 12%, according to Tropic.

Method
Analysis of Tropic's procurement data, over $18B in spend under management
Sample
Tropic customers; $18B+ spend under management
#

29%

achieved expected SaaS cost savings

Capgemini Research Institute, On-Demand Tech (FinOps) report

Survey · n=1,000 executives · 2025

Method and full statement

Only 29% of large organizations achieved the SaaS cost savings they expected, according to Capgemini Research Institute.

Method
Survey of 1,000 executives at organizations with $1B+ annual revenue using cloud, SaaS and GenAI, across 12 sectors and 14 countries; fielded May 2025
Sample
n=1,000 executives
#

20%

drop in average contract value in 2024

Vendr, Vendr SaaS Trends Report 2025 (Plus 2024 Year-in Review)

Observed data · 2025

Method and full statement

Vendr reported that average contract values fell 20%, from $50,000 to $40,000, during 2024 as buyers rightsized at renewal in what it called the 'Year of the Descope'.

Method
Transaction data from Vendr's buying platform; sampling method not detailed
Sample
not stated
#

56%

are rightsizing contracts and subscriptions

Flexera, 2025 State of ITAM Report

Survey · n=506 IT professionals · 2025

Method and full statement

56% of organizations are rightsizing contracts and subscriptions and 59% are actively tracking usage to cut SaaS costs, Flexera's 2025 State of ITAM Report found.

Method
Survey of global IT professionals across industries
Sample
n=506 IT professionals
#

63%

cite unused apps or budget as consolidation driver

BetterCloud, 2025 State of SaaS (as summarized on BetterCloud's SaaS statistics page)

Survey · n≈600 IT professionals · 2025

Method and full statement

63% of IT teams say too many unused or underutilized SaaS apps and licenses, or budget pressure, are driving app consolidation, per BetterCloud's 2025 State of SaaS report.

Method
Survey of IT professionals
Sample
n≈600 IT professionals
#

45%

saved by reusing licenses instead of buying

Flexera, 2024 State of ITAM Report

Survey · n=503 · 2024

Method and full statement

Reusing licenses instead of buying new ones (non-cloud) was the top way SAM teams achieved significant savings in the past year, cited by 45%, ahead of better vendor negotiation at 37%, per Flexera's 2024 State of ITAM Report.

Method
Survey of professionals in organizations with 1,000+ employees who manage or participate in ITAM, SAM and HAM processes
Sample
n=503
#
Show all 10 stats in this section

16.49%

average savings on negotiated software deals

Vendr, SaaS statistics: trends, data and insights (updated 2023)

Observed data · 20,000+ deals · 2023

Method and full statement

Vendr's analysis of more than 20,000 software deals found negotiation saved buyers 16.49% on average, a total of $349 million.

Method
Transaction data: over 20,000 deals, 2,500 suppliers and $2.3B processed spend on Vendr's platform
Sample
20,000+ deals; 2,500 suppliers; $2.3B spend
#

55%

saved $1M+ a year through SAM

Flexera, 2023 State of ITAM Report

Survey · n=500 · 2023

Method and full statement

55% of organizations saved more than $1 million through software asset management in a year, and 16% saved more than $10 million, according to Flexera's 2023 State of ITAM Report.

Method
Survey of global professionals in organizations with at least 1,000 employees
Sample
n=500
#

Audits and true-ups 8 stats

48%

were hit by a software audit last year

Flexera, 2026 State of ITAM Report

Survey · n=512 technology professionals · 2026

Method and full statement

Nearly half (48%) of organizations were audited by a software vendor in the last year, according to Flexera's 2026 State of ITAM Report.

Method
Survey of technology professionals worldwide across industries
Sample
n=512 technology professionals
#

38%

of respondents report Oracle audits

Flexera, 2026 State of ITAM Report

Survey · n=512 technology professionals · 2026

Method and full statement

Respondents reporting Oracle audit activity rose to 38% from 24% a year earlier, and Adobe from 24% to 32%, according to Flexera's 2026 State of ITAM Report.

Method
Survey of technology professionals worldwide across industries
Sample
n=512 technology professionals
#

22%

of ITAM team time spent on audit response

Flexera, 2026 State of ITAM Report

Survey · n=512 technology professionals · 2026

Method and full statement

IT asset management teams spend 32% of their time on software optimization and another 22% responding to audits, according to Flexera's 2026 State of ITAM Report.

Method
Survey of technology professionals worldwide across industries
Sample
n=512 technology professionals
#

44%

spent over $1M on software audits in three years

Flexera, 2026 State of ITAM Report

Survey · n=512 · 2026

Method and full statement

44% of organizations spent more than $1 million on software audits over the past three years, according to Flexera's 2026 State of ITAM Report.

Method
Survey of technology professionals worldwide
Sample
n=512
#

45%

spent over $1M on software audits in 3 years

Flexera, 2025 State of ITAM Report

Survey · n=506 IT professionals · 2025

Method and full statement

45% of organizations spent more than $1 million on software audits over the past three years, according to Flexera's 2025 State of ITAM Report.

Method
Survey of global IT professionals across industries
Sample
n=506 IT professionals
#

50%

were audited by Microsoft in 3 years

Flexera, 2025 State of ITAM Report

Survey · n=506 IT professionals · 2025

Method and full statement

Half of organizations say Microsoft audited them in the past three years, followed by IBM at 37% and SAP at 32%, per Flexera's 2025 State of ITAM Report.

Method
Survey of global IT professionals across industries
Sample
n=506 IT professionals
#

23%

of software producers call license overuse a major problem

Revenera, Monetization Monitor 2026 Outlook

Survey · n=501 · 2025

Method and full statement

23% of software producers report customer license overuse (unintentional or otherwise) as a major problem and another 47% as a moderate concern, according to Revenera's Monetization Monitor 2026 Outlook.

Method
Survey of leaders at software producers (42% C-level, 34% director)
Sample
n=501
#

22%

paid $5M+ in audit costs over 3 years

Flexera, 2024 State of ITAM Report

Survey · n=503 · 2024

Method and full statement

22% of IT leaders paid more than $5 million in software audit costs over three years, up from 15% the previous year, according to Flexera's 2024 State of ITAM Report.

Method
Survey of professionals in organizations with 1,000+ employees who manage or participate in ITAM, SAM and HAM processes
Sample
n=503
#

AI spend · 78 stats

AI spend and ROI statistics

AI budgets are climbing fast, the bills are hard to forecast, and the returns are still arriving.

Torii dataHow often apps blow past their contractOverage frequency: how often spend exceeds the contracted amount.
  • ChatGPT35.4%
  • Keeper Security33.3%
  • n8n33.3%
  • ClickUp33.3%
  • Zoom30.1%
  • Fivetran29.4%
  • Claude AI25.0%
  • Cursor AI23.7%
  • OpenAI22.5%
  • Snowflake21.7%
  • Anthropic20.0%
  • Iru18.9%

Source: Torii, SaaS Benchmark Annual Report 2026, "Overage Frequency" chart.

See the full chart in the benchmark report
Torii dataAnd by how muchOverage intensity: median percent over contract, same apps.
  • Cursor AI20.5%
  • ChatGPT13.0%
  • Anthropic9.1%
  • Zoom7.4%
  • ClickUp7.1%
  • OpenAI6.8%
  • Fivetran6.1%
  • Keeper Security4.6%
  • Iru3.5%
  • Claude AI2.8%
  • Snowflake1.7%
  • n8n0.3%

Source: Torii, SaaS Benchmark Annual Report 2026, "Overage Intensity" chart.

See the full chart in the benchmark report

AI budgets keep climbing 21 stats

$37B

enterprise generative AI spend in 2025

Menlo Ventures, 2025: The State of Generative AI in the Enterprise

Survey · ~500 U.S. enterprise decision-makers · 2025

Method and full statement

According to Menlo Ventures, enterprise generative AI spend reached $37B in 2025, up from $1.7B in 2023, and now equals 6% of the global SaaS market.

Method
Survey of ~500 U.S. enterprise AI decision-makers combined with a bottoms-up model of the generative AI market (model APIs, infrastructure, applications)
Sample
~500 U.S. enterprise decision-makers
#

$11.95

median AI spend per employee per month

Ramp (Ramp Economics Lab), Ramp AI Index, August 2026 update

Observed data · 70,000+ U.S. businesses · 2026

Method and full statement

Ramp's spend data shows the median U.S. business spent $11.95 per employee on AI in July 2026, while the top 1% spent a median $7,400 per employee.

Method
Telemetry: monthly observed AI spend (card, invoice, ACH via Ramp) divided by matched employee counts
Sample
70,000+ U.S. businesses
#

94% vs 8%

YoY spend growth, AI-native vs traditional SaaS

Tropic, 2026 Software and AI Pricing Trends

Observed data · $18B+ spend under management · 2026

Method and full statement

For mid-market and enterprise companies, spend on AI-native software grew 94% year over year while spend on traditional SaaS grew just 8%, according to Tropic.

Method
Transaction data: analysis of $18B+ in spend under management across Tropic customers; cohorts SMB/Growth (1-250 employees) and Mid-Market/Enterprise (251+)
Sample
$18B+ spend under management
#

4.8%

of software budgets go to AI-native vendors

Tropic, AI Spending and Pricing Trends H1 2026

Observed data · Tropic customer base · 2026

Method and full statement

AI-native vendors took 4.8% of the average software budget in July 2026, more than double the 2.3% share in January 2025, according to Tropic.

Method
Transaction data across Tropic's customer network
Sample
Tropic customer base (size not stated on page)
#

$207M

average planned AI spend over next 12 months ($1B+ firms)

KPMG US, AI Quarterly Pulse Survey, Q1 2026

Survey · n=237 U.S. leaders · 2026

Method and full statement

According to KPMG's Q1 2026 AI Quarterly Pulse, large U.S. organizations plan to spend an average of $207 million on AI over the next 12 months, nearly double a year earlier.

Method
Survey of U.S.-based C-suite and business leaders at organizations with $1B+ annual revenue
Sample
n=237 U.S. leaders ($1B+ revenue)
#
Show all 21 stats in this section

$2,068

expected AI spend per employee in 2026

Federal Reserve Bank of Atlanta, How Much Are Firms Spending on AI (and What Will Happen to Headcounts)? (Policy Hub: Macroblog)

Survey · 2026

Method and full statement

Atlanta Fed survey data show U.S. firms spent $1,358 per employee on AI in 2025 and expect to spend $2,068 per employee in 2026, about a 50% increase.

Method
Survey of senior U.S. business executives (Atlanta Fed survey work with Stanford/Chicago researchers); employment-weighted
Sample
not stated
#

14x

AI spend gap: top 10% of firms vs the median

Federal Reserve Bank of Atlanta, How Much Are Firms Spending on AI (and What Will Happen to Headcounts)? (Policy Hub: Macroblog)

Survey · 2026

Method and full statement

According to the Atlanta Fed, more than half of firms expect to spend no more than $200 per employee on AI in 2026, while the top 10% plan at least $2,800, a 14-fold gap.

Method
Survey of senior U.S. business executives (Atlanta Fed survey work with Stanford/Chicago researchers); employment-weighted
Sample
not stated
#

7%

of LLM spend still from innovation budgets

Andreessen Horowitz (a16z), How 100 Enterprise CIOs Are Building and Buying Gen AI in 2025

Survey · n=100 CIOs · 2025

Method and full statement

a16z found that innovation budgets fell from a quarter of enterprise LLM spending to just 7% in 2025, as AI moved into centralized IT and business-unit budgets.

Method
Survey of 100 CIOs across 15 industries plus conversations with 25+ enterprise buyers
Sample
n=100 CIOs
#

$85,521

average monthly AI spend expected in 2025

CloudZero, The State Of AI Costs In 2025

Survey · 500+ software professionals · 2025

Method and full statement

CloudZero's State of AI Costs survey found average monthly AI spend of $62,964 in 2024, rising to an expected $85,521 in 2025, a 36% increase.

Method
Survey of software professionals at the manager level and above in the U.S.
Sample
500+ software professionals (manager level and above)
#

45%

plan to spend $100K+ per month on AI

CloudZero, The State Of AI Costs In 2025

Survey · 500+ software professionals · 2025

Method and full statement

According to CloudZero, the share of organizations planning to spend over $100,000 a month on AI tools more than doubled, from 20% in 2024 to 45% in 2025.

Method
Survey of software professionals at the manager level and above in the U.S.
Sample
500+ software professionals (manager level and above)
#

91%

plan to increase AI investment again

Deloitte, AI ROI: The paradox of rising investment and elusive returns

Survey · n=1,854 executives · 2025

Method and full statement

Deloitte found 85% of organizations increased AI investment in the past 12 months and 91% plan to increase it again.

Method
Survey of executives across Europe and the Middle East plus 24 in-depth interviews
Sample
n=1,854 executives
#

36%

of digital initiative budgets go to AI

Deloitte, Tech value survey 2025 (AI and tech investment ROI)

Survey · ~550 leaders · 2025

Method and full statement

According to Deloitte's 2025 Tech Value Survey, organizations now allocate an average of 36% of their digital initiative budgets to AI automation.

Method
Survey of business and technology leaders across five industries (Deloitte Tech Value Survey)
Sample
~550 leaders
#

42% vs 18%

above-average profitability with vs without CFO authority

Deloitte, C-suite leadership and AI returns (Tech Value Survey analysis)

Survey · n=550 leaders · 2025

Method and full statement

Deloitte found that when the CFO had full decision-making authority over digital investments, 42% of organizations achieved above-average profitability, versus 18% where the CFO had none.

Method
Predictive analysis of a survey of business and technology leaders
Sample
n=550 leaders
#

27% to 52%

spending a quarter+ of IT budget on AI, now vs next year

EY, EY US AI Pulse Survey, wave 4 (press release)

Survey · n=500 senior US decision-makers · 2025

Method and full statement

EY found 27% of organizations investing in AI commit a quarter or more of their IT budget to AI today, a share set to nearly double to 52% next year.

Method
Survey of US-employed decision-makers (SVP and above), n=50 per industry across 10 industries; MOE +/-4 pts
Sample
n=500 senior US decision-makers
#

10-20%

of R&D budgets going to AI development

ICONIQ, 2025 State of AI: The Builder's Playbook

Survey · n=300 software-company executives · 2025

Method and full statement

ICONIQ's 2025 State of AI report found AI-enabled software companies allocate 10-20% of R&D budgets to AI development, a share growing in every revenue band.

Method
Survey of executives at software companies plus interviews with AI leaders in the ICONIQ community
Sample
n=300 software-company executives
#

446%

12-month growth in AI spend (vs 36% for SaaS)

Cledara, The 2025 Software Spend Report

Observed data · Cledara customer transactions · 2024

Method and full statement

AI spending grew 446% over 12 months, compared with 36% growth in overall SaaS spending, according to Cledara's transaction data.

Method
Cledara transaction data (1M+ transactions with 5,000+ vendors) plus a survey of 200+ tech companies with fewer than 200 staff in the US, UK and EU
Sample
Cledara customer transactions
#

60%

of 2024 GenAI spend came from innovation budgets

Menlo Ventures, 2024: The State of Generative AI in the Enterprise

Survey · n=600 U.S. IT decision-makers · 2024

Method and full statement

In 2024, Menlo Ventures found that 60% of enterprise generative AI spend came from innovation budgets rather than permanent budget lines.

Method
Survey of 600 U.S. IT decision-makers at enterprises with 50+ employees
Sample
n=600 U.S. IT decision-makers
#

Where the AI money goes 18 stats

43.8%

of U.S. businesses paying Anthropic (vs 39.8% OpenAI)

Ramp (Ramp Economics Lab), Ramp AI Index, September 2026 update

Observed data · 70,000+ U.S. businesses · 2026

Method and full statement

According to the Ramp AI Index, 43.8% of U.S. businesses paid for Anthropic subscriptions or tokens in August 2026, ahead of OpenAI at 39.8%.

Method
Telemetry: corporate card, invoice and ACH transactions from 70,000+ U.S. businesses on Ramp; adoption = share of businesses with an observed payment for an AI product in the month
Sample
70,000+ U.S. businesses
#

3.6%

of businesses use open-source AI models

Ramp (Ramp Economics Lab), Ramp AI Index, September 2026 update

Observed data · 70,000+ U.S. businesses · 2026

Method and full statement

According to Ramp, only 6.4% of AI-spending businesses (3.6% of all businesses) use open-source models.

Method
Telemetry: adoption of model routing platforms as a proxy for open-source model use
Sample
70,000+ U.S. businesses
#

50.4%

of businesses now pay for AI services

Ramp, Spring 2026 Business Spending Report

Observed data · 50,000+ businesses · 2026

Method and full statement

Ramp's Spring 2026 spending report found that more than half of businesses (50.4%) now pay for AI services, and Anthropic's share of paid AI customers jumped from 16.7% to 30.6% in one quarter.

Method
Telemetry: $100B+ of anonymized card and bill pay transactions from 50,000+ businesses
Sample
50,000+ businesses
#

2.4

AI coding tools in use at once, on average

Mavvrik and Benchmarkit, 2026 State of AI Cost Governance Report

Survey · n=396 enterprise organizations · 2026

Method and full statement

Mavvrik found engineering organizations run an average of 2.4 AI coding tools at once, 39% report coding-tool costs above expected license or usage, and only 42% include developer AI tools in AI cost reporting.

Method
Survey of enterprise organizations across Technology/SaaS, Financial Services, Retail, Manufacturing and other industries
Sample
n=396 enterprise organizations
#

88%

of organizations use AI; agent use still single digits

Stanford HAI, AI Index Report 2026, Economy chapter

Vendor or analysis · 2026

Method and full statement

Stanford's 2026 AI Index reports organizational AI adoption rose to 88% of surveyed organizations in 2025, but AI agent deployment was still in the single digits across nearly all business functions.

Method
Compilation of third-party data; organizational adoption figures drawn from an employer survey (McKinsey State of AI)
Sample
not stated on page
#
Show all 18 stats in this section

76%

of enterprise AI solutions bought, not built

Menlo Ventures, 2025: The State of Generative AI in the Enterprise

Survey · ~500 U.S. enterprise decision-makers · 2025

Method and full statement

Menlo Ventures found that 76% of enterprise AI use cases are now purchased rather than built internally, up from 53% purchased in 2024.

Method
Survey of ~500 U.S. enterprise AI decision-makers combined with a bottoms-up model of the generative AI market (model APIs, infrastructure, applications)
Sample
~500 U.S. enterprise decision-makers
#

40%

Anthropic's share of enterprise LLM API spend

Menlo Ventures, 2025: The State of Generative AI in the Enterprise

Survey · ~500 U.S. enterprise decision-makers · 2025

Method and full statement

According to Menlo Ventures, Anthropic holds 40% of enterprise LLM API market share in 2025, versus 27% for OpenAI.

Method
Survey of ~500 U.S. enterprise AI decision-makers combined with a bottoms-up model of the generative AI market (model APIs, infrastructure, applications)
Sample
~500 U.S. enterprise decision-makers
#

16%

of enterprise AI deployments are true agents

Menlo Ventures, 2025: The State of Generative AI in the Enterprise

Survey · ~500 U.S. enterprise decision-makers · 2025

Method and full statement

Menlo Ventures found that only 16% of enterprise AI deployments (and 27% of startup deployments) qualify as true agents.

Method
Survey of ~500 U.S. enterprise AI decision-makers combined with a bottoms-up model of the generative AI market (model APIs, infrastructure, applications)
Sample
~500 U.S. enterprise decision-makers
#

60%

of the top 50 AI apps by spend are horizontal tools

Andreessen Horowitz (a16z) with Mercury, The AI Application Spending Report: Where Startup Dollars Really Go

Observed data · 200,000+ Mercury customers · 2025

Method and full statement

a16z and Mercury's ranking of the top 50 AI apps by actual startup spend found horizontal tools make up 60% of the list, led by #1 OpenAI and #2 Anthropic.

Method
Telemetry: spend transactions (ACH, card, wires) across Mercury's 200,000+ customers, ranked to a top 50 of AI-native application companies
Sample
200,000+ Mercury customers (mostly startups)
#

67%

deployment rate for bought AI tools (vs 33% built)

MIT NANDA (Project NANDA, MIT Media Lab), The GenAI Divide: State of AI in Business 2025

Survey · 52 organizations interviewed · 2025

Method and full statement

MIT NANDA found that AI tools bought from external partners reached deployment about 67% of the time, versus about 33% for internally built tools.

Method
Review of 300+ publicly disclosed AI initiatives, structured interviews with representatives of 52 organizations, and survey responses from 153 senior leaders at four industry conferences
Sample
52 organizations interviewed; 153 leaders surveyed; 300+ public initiatives
#

50%

of GenAI budgets flow to sales and marketing

MIT NANDA (Project NANDA, MIT Media Lab), The GenAI Divide: State of AI in Business 2025

Survey · 52 organizations interviewed · 2025

Method and full statement

MIT NANDA estimates about 50% of generative AI budgets go to sales and marketing, even though back-office automation often delivers better ROI.

Method
Review of 300+ publicly disclosed AI initiatives, structured interviews with representatives of 52 organizations, and survey responses from 153 senior leaders at four industry conferences
Sample
52 organizations interviewed; 153 leaders surveyed; 300+ public initiatives
#

50%

of CEOs say AI investment left disconnected tech

IBM Institute for Business Value, 2025 CEO Study (press release)

Survey · n=2,000 CEOs · 2025

Method and full statement

IBM found half of CEOs say rapid AI investment has left their organization with disconnected, piecemeal technology.

Method
IBM IBV with Oxford Economics surveyed CEOs from 33 countries and 24 industries
Sample
n=2,000 CEOs
#

2.8

AI models used per company for customer-facing products

ICONIQ, 2025 State of AI: The Builder's Playbook

Survey · n=300 software-company executives · 2025

Method and full statement

According to ICONIQ, software companies use an average of 2.8 AI models for customer-facing products.

Method
Survey of executives at software companies plus interviews with AI leaders in the ICONIQ community
Sample
n=300 software-company executives
#

3+

foundation models in a typical enterprise AI stack

Menlo Ventures, 2024: The State of Generative AI in the Enterprise

Survey · n=600 U.S. IT decision-makers · 2024

Method and full statement

Menlo Ventures found that organizations typically deploy three or more foundation models, routing between them by use case.

Method
Survey of 600 U.S. IT decision-makers at enterprises with 50+ employees
Sample
n=600 U.S. IT decision-makers
#

1%

of enterprise AI buyers cited price as a concern

Menlo Ventures, 2024: The State of Generative AI in the Enterprise

Survey · n=600 U.S. IT decision-makers · 2024

Method and full statement

Menlo Ventures found that just 1% of enterprise leaders named price as a selection concern when choosing generative AI tools.

Method
Survey of 600 U.S. IT decision-makers at enterprises with 50+ employees
Sample
n=600 U.S. IT decision-makers
#

Bills nobody can forecast 23 stats

Torii data

35.4%

overage frequency for ChatGPT

Torii, SaaS Benchmark Annual Report 2026

Observed data · 2026

Method and full statement

ChatGPT exceeds its contracted ceiling 35.4% of the time with a median overage of 13.0%, according to Torii's 2026 SaaS Benchmark.

Method
Observed: aggregated, anonymized discovery data from environments Torii connects to
Sample
not published
#
Torii data

Majority

of chronic contract overages are AI apps

Torii, SaaS Benchmark Annual Report 2026

Observed data · 2026

Method and full statement

The majority of applications that consistently exceed their contracted ceilings are AI-powered, according to Torii's 2026 SaaS Benchmark.

Method
Observed: aggregated, anonymized discovery data from environments Torii connects to
Sample
not published
#

11%

can forecast AI costs within ±10%

Mavvrik and Benchmarkit, 2026 State of AI Cost Governance Report

Survey · n=396 enterprise organizations · 2026

Method and full statement

Mavvrik's 2026 State of AI Cost Governance report found only 11% of organizations can forecast AI costs within ±10%, down from 15% in 2025.

Method
Survey of enterprise organizations across Technology/SaaS, Financial Services, Retail, Manufacturing and other industries
Sample
n=396 enterprise organizations
#

80%

of enterprises miss AI cost forecasts by 25%+

Mavvrik and Benchmarkit, 2025 State of AI Cost Management (State of AI Cost Governance)

Survey · n=372 enterprise organizations · 2025

Method and full statement

According to Mavvrik and Benchmarkit, 80% of enterprises miss their AI infrastructure cost forecasts by more than 25%, and 24% are off by 50% or more.

Method
Survey of enterprise organizations across industries and revenue tiers on AI cost governance, forecasting and margin impact
Sample
n=372 enterprise organizations
#
Torii data

20.5%

median overage for Cursor

Torii, SaaS Benchmark Annual Report 2026

Observed data · 2026

Method and full statement

Cursor AI runs a median 20.5% over contract when it overages, the highest intensity in Torii's 2026 SaaS Benchmark.

Method
Observed: aggregated, anonymized discovery data from environments Torii connects to
Sample
not published
#

59%

say wasted AI spend rose this year

Flexera, 2026 State of ITAM Report

Survey · n=512 technology professionals · 2026

Method and full statement

59% of IT asset managers say wasted AI spend increased year over year, according to Flexera's 2026 State of ITAM Report.

Method
Survey of technology professionals worldwide across industries
Sample
n=512 technology professionals
#

31%

have accurate visibility into AI software

Flexera, 2026 State of ITAM Report

Survey · n=512 technology professionals · 2026

Method and full statement

Only 31% of organizations have accurate visibility into their AI software, according to Flexera's 2026 State of ITAM Report.

Method
Survey of technology professionals worldwide across industries
Sample
n=512 technology professionals
#

50%

higher AI tool expense without central management

Gartner (via USU reprint), 2026 Gartner Magic Quadrant for SaaS Management Platforms

Forecast · 2026

Method and full statement

Gartner predicts that through 2029, organizations that do not centrally monitor and manage SaaS-hosted AI tools will incur at least 50% higher expense and be at least five times more likely to suffer a cyber incident.

Method
Analyst forecast (strategic planning assumption)
Sample
not applicable
#
Show all 23 stats in this section

-41%

drop in effective price per million tokens

Ramp (Ramp Economics Lab), Ramp AI Index, September 2026 update

Observed data · 2026

Method and full statement

Ramp's token price index shows the effective price businesses pay per million AI tokens fell 41% to $0.68 by September 2026, down from a 2026 peak of $1.15 in March.

Method
Telemetry: effective price per million tokens from Ramp's token spend data
Sample
Ramp business customers using token spend tracking
#

40%

escalated surprise AI costs to the board

Mavvrik and Benchmarkit, 2026 State of AI Cost Governance Report

Survey · n=396 enterprise organizations · 2026

Method and full statement

According to Mavvrik, 40% of organizations had to escalate a surprise AI cost to the board in the past year, 33% imposed emergency spending freezes and 25% delayed or cancelled an AI initiative.

Method
Survey of enterprise organizations across Technology/SaaS, Financial Services, Retail, Manufacturing and other industries
Sample
n=396 enterprise organizations
#

49%

had to reprice AI products after cost surprises

Mavvrik and Benchmarkit, 2026 State of AI Cost Governance Report

Survey · n=396 enterprise organizations · 2026

Method and full statement

According to Mavvrik, 49% of companies were forced to reprice AI-powered products because of unforeseen AI cost increases.

Method
Survey of enterprise organizations across Technology/SaaS, Financial Services, Retail, Manufacturing and other industries
Sample
n=396 enterprise organizations
#

15%

can't attribute AI agent costs at any level

Mavvrik and Benchmarkit, 2026 State of AI Cost Governance Report

Survey · n=396 enterprise organizations · 2026

Method and full statement

Mavvrik found only 44% of organizations include on-prem AI infrastructure in cost reporting, and 15% of those running agentic workloads cannot attribute agent costs at any level.

Method
Survey of enterprise organizations across Technology/SaaS, Financial Services, Retail, Manufacturing and other industries
Sample
n=396 enterprise organizations
#

1 in 3

organizations overspent on AI applications

Flexera, Flexera 2026 AI Pulse Report

Survey · 2026

Method and full statement

According to Flexera's 2026 AI Pulse Report, 80% of organizations increased AI investment, yet more than a third say they overspent on AI applications and 14% report wasted AI spend.

Method
method not stated on page (Flexera survey research)
Sample
not stated
#

74%

now require cost reviews before approving AI

KPMG US, Quarterly AI Pulse Survey, Q3 2026

Survey · n=314 U.S. leaders · 2026

Method and full statement

KPMG's Q3 2026 AI Pulse found 74% of large organizations now include cost reviews in AI approvals (up from 61% a quarter earlier), and 43% have usage or token budgets.

Method
Survey of U.S.-based C-suite and business leaders at organizations with $1B+ annual revenue
Sample
n=314 U.S. leaders ($1B+ revenue)
#

~1 in 2

rephased AI deployments when costs outran value

KPMG International, Global AI Pulse Q2 2026

Survey · n=2,145 senior leaders · 2026

Method and full statement

KPMG's Global AI Pulse found nearly half of organizations have rephased AI deployments when costs began to outweigh expected value.

Method
Survey of senior leaders with direct knowledge of AI use; organizations with US$50M+ revenue (US$1B+ for U.S. sample); 20 countries
Sample
n=2,145 senior leaders
#

5x

more likely to see ROI with full AI cost visibility

KPMG International, Global AI Pulse Q2 2026

Survey · n=2,145 senior leaders · 2026

Method and full statement

According to KPMG, organizations with full visibility into AI operating costs are five times more likely to report established ROI than those without (15% vs. 3%).

Method
Survey of senior leaders with direct knowledge of AI use; organizations with US$50M+ revenue (US$1B+ for U.S. sample); 20 countries
Sample
n=2,145 senior leaders
#

60-70%

annual decline in inference cost per token

Goldman Sachs Research, AI Agents Forecast to Boost Tech Cash Flow as Usage Soars

Forecast · 2026

Method and full statement

Goldman Sachs Research says chipmakers are cutting the cost per token for AI inference by 60-70% a year, while forecasting agentic AI will drive a 24-fold increase in token consumption by 2030.

Method
Analyst forecast
Sample
not stated
#

85%

of tech execs lack real-time visibility into AI spend

IBM Institute for Business Value, CIO/CTO AI control gap study (with Oxford Economics)

Survey · n=2,000 · 2026

Method and full statement

85% of technology executives lack full visibility into real-time AI spend, and AI is projected to grow from under 15% of IT budgets in 2025 to nearly 25% by 2027, according to IBM.

Method
Survey of senior technology executives
Sample
n=2,000
#

1 in 3

IT leaders believe they overspend on AI apps

Flexera, Flexera IT Priorities Report (2026 strategy)

Survey · n=834 IT decision-makers · 2025

Method and full statement

80% of IT leaders report increased spending on AI applications and over a third believe they are overspending, according to Flexera's 2026 IT Priorities report.

Method
Survey of global IT decision-makers
Sample
n=834 IT decision-makers
#

84%

see 6%+ gross margin erosion from AI costs

Mavvrik and Benchmarkit, 2025 State of AI Cost Management (State of AI Cost Governance)

Survey · n=372 enterprise organizations · 2025

Method and full statement

Mavvrik and Benchmarkit found 84% of companies see gross margins eroded by 6% or more because of AI infrastructure costs, with 26% hit by 16% or more.

Method
Survey of enterprise organizations across industries and revenue tiers on AI cost governance, forecasting and margin impact
Sample
n=372 enterprise organizations
#

Still waiting on the return 16 stats

95%

of organizations getting zero return from GenAI

MIT NANDA (Project NANDA, MIT Media Lab), The GenAI Divide: State of AI in Business 2025

Survey · 52 organizations interviewed · 2025

Method and full statement

MIT NANDA's GenAI Divide report found that despite $30-40 billion in enterprise investment, 95% of organizations are getting zero return from generative AI.

Method
Review of 300+ publicly disclosed AI initiatives, structured interviews with representatives of 52 organizations, and survey responses from 153 senior leaders at four industry conferences
Sample
52 organizations interviewed; 153 leaders surveyed; 300+ public initiatives
#

28%

of I&O AI use cases fully meet ROI expectations

Gartner, Press release: Gartner Says AI Projects in I&O Stall Ahead of Meaningful ROI Returns

Survey · n=782 I&O managers · 2026

Method and full statement

A Gartner survey of 782 infrastructure and operations leaders found only 28% of AI use cases in I&O fully succeed and meet ROI expectations, while 20% fail outright.

Method
Survey of infrastructure and operations (I&O) leaders
Sample
n=782 I&O managers
#

20%

already growing revenue with AI (74% hope to)

Deloitte AI Institute, The State of AI in the Enterprise, 2026

Survey · n=3,235 leaders · 2026

Method and full statement

Deloitte's State of AI in the Enterprise 2026 found 74% of organizations hope to grow revenue through AI, but only 20% are already doing so.

Method
Global survey of senior leaders (board, C-suite, president, VP and director levels), split equally between IT and line-of-business
Sample
n=3,235 leaders
#

~40%

of AI time savings lost to rework

Workday, Beyond Productivity: Measuring the Real Value of AI (press release)

Survey · n=3,200 employees · 2026

Method and full statement

Workday research found nearly 40% of the time employees save with AI is lost to rework, and only 14% consistently get clear, positive net outcomes from AI.

Method
Survey by Workday, fielded by Hanover Research, of full-time employees at $100M+ revenue organizations who actively use AI
Sample
n=3,200 employees (NA, APAC, EMEA)
#

19%

say AI initiatives met or beat ROI goals

Foundry (CIO.com), 2026 State of the CIO Study

Survey · 662 IT leaders + 249 LOB · 2026

Method and full statement

Only 19% of IT leaders say AI initiatives have met or exceeded ROI goals, according to Foundry's 2026 State of the CIO study.

Method
Online survey of heads of IT
Sample
662 IT leaders + 249 LOB
#

47%

of AI deals reach production (vs 25% for SaaS)

Menlo Ventures, 2025: The State of Generative AI in the Enterprise

Survey · ~500 U.S. enterprise decision-makers · 2025

Method and full statement

According to Menlo Ventures, 47% of AI deals go to production once an organization commits to exploring a solution, nearly twice the 25% rate for traditional SaaS.

Method
Survey of ~500 U.S. enterprise AI decision-makers combined with a bottoms-up model of the generative AI market (model APIs, infrastructure, applications)
Sample
~500 U.S. enterprise decision-makers
#

51%

can confidently evaluate AI ROI

CloudZero, The State Of AI Costs In 2025

Survey · 500+ software professionals · 2025

Method and full statement

CloudZero found only about half (51%) of organizations can confidently evaluate the ROI of their AI costs.

Method
Survey of software professionals at the manager level and above in the U.S.
Sample
500+ software professionals (manager level and above)
#

2-4 yrs

typical payback on an AI use case

Deloitte, AI ROI: The paradox of rising investment and elusive returns

Survey · n=1,854 executives · 2025

Method and full statement

Deloitte found most organizations achieve satisfactory ROI on a typical AI use case only after two to four years; just 6% saw payback in under a year.

Method
Survey of executives across Europe and the Middle East plus 24 in-depth interviews
Sample
n=1,854 executives
#
Show all 16 stats in this section

10%

of agentic AI users see significant ROI

Deloitte, AI ROI: The paradox of rising investment and elusive returns

Survey · n=1,854 executives · 2025

Method and full statement

According to Deloitte, just 10% of organizations using agentic AI say they are currently realizing significant ROI from it.

Method
Survey of executives across Europe and the Middle East plus 24 in-depth interviews
Sample
n=1,854 executives
#

60%

of companies report minimal AI value

Boston Consulting Group (BCG), The Widening AI Value Gap (press release)

Survey · n=1,250 executives · 2025

Method and full statement

BCG found 60% of companies are AI 'laggards' reporting minimal revenue and cost gains, while just 5% qualify as 'future-built' for AI.

Method
Global survey of senior executives and AI decision makers across nine industries
Sample
n=1,250 executives
#

25%

of AI initiatives delivered expected ROI

IBM Institute for Business Value, 2025 CEO Study (press release)

Survey · n=2,000 CEOs · 2025

Method and full statement

IBM's 2025 CEO Study found only 25% of AI initiatives have delivered expected ROI over the last few years, and only 16% have scaled enterprise-wide.

Method
IBM IBV with Oxford Economics surveyed CEOs from 33 countries and 24 industries
Sample
n=2,000 CEOs
#

64%

of CEOs invest in tech before understanding its value

IBM Institute for Business Value, 2025 CEO Study (press release)

Survey · n=2,000 CEOs · 2025

Method and full statement

According to IBM, 64% of CEOs admit fear of falling behind drives them to invest in technologies before they clearly understand the value.

Method
IBM IBV with Oxford Economics surveyed CEOs from 33 countries and 24 industries
Sample
n=2,000 CEOs
#

70%

of employees given AI tools; about half use them

ICONIQ, 2025 State of AI: The Builder's Playbook

Survey · n=300 software-company executives · 2025

Method and full statement

ICONIQ found most companies give about 70% of employees access to internal AI tools, but only about half use them regularly.

Method
Survey of executives at software companies plus interviews with AI leaders in the ICONIQ community
Sample
n=300 software-company executives
#

26%

of failed AI pilots blamed on implementation costs

Menlo Ventures, 2024: The State of Generative AI in the Enterprise

Survey · n=600 U.S. IT decision-makers · 2024

Method and full statement

According to Menlo Ventures, implementation costs were cited in 26% of failed generative AI pilots, ahead of data privacy (21%) and disappointing ROI (18%).

Method
Survey of 600 U.S. IT decision-makers at enterprises with 50+ employees
Sample
n=600 U.S. IT decision-makers
#

30%

of GenAI projects abandoned after proof of concept

Gartner, Press release: Gartner Predicts 30% of Generative AI Projects Will Be Abandoned After Proof of Concept By End of 2025

Forecast · 2024

Method and full statement

Gartner predicted at least 30% of generative AI projects would be abandoned after proof of concept by the end of 2025, citing poor data quality, risk controls, escalating costs or unclear value.

Method
Analyst prediction (Gartner Data & Analytics Summit, Sydney)
Sample
not stated
#

74%

of companies have yet to show tangible AI value

Boston Consulting Group (BCG), Where's the Value in AI? (press release)

Survey · n=1,000 executives · 2024

Method and full statement

BCG's 2024 research found 74% of companies have yet to show tangible value from their use of AI, and only 4% have cutting-edge AI capabilities across functions.

Method
Survey of CxOs and senior executives from 20+ sectors in 59 countries
Sample
n=1,000 executives
#

Joiners & leavers · 70 stats

Joiners, movers and leavers statistics

Access outlives the job. Departing employees keep seats, tokens and data long after they leave.

Torii data1 in 40 paid seats belongs to someone who already leftAn average of 2.5% of license seats are assigned to offboarded users.

Source: Torii, SaaS Benchmark Annual Report 2026, "The Living Dead" chapter.

See the full chart in the benchmark report

Leavers who never quite leave 22 stats

Torii data

2.5%

of seats are assigned to offboarded users

Torii, SaaS Benchmark Annual Report 2026

Observed data · 2026

Method and full statement

An average of 2.5% of license seats are assigned to offboarded users, roughly 1 in 40, according to Torii's 2026 SaaS Benchmark.

Method
Observed: aggregated, anonymized discovery data from environments Torii connects to
Sample
not published
#

38%

of employees have accessed a former employer's account

1Password, Annual Report 2025: The Access-Trust Gap

Survey · n=5,200 knowledge workers · 2025

Method and full statement

38% of employees say they have successfully accessed a prior employer's account, according to 1Password's 2025 Access-Trust Gap report.

Method
Survey: online survey of 5,200 desk-based knowledge workers (including IT and security professionals) in the U.S., Canada, UK, Germany, France and Singapore
Sample
n=5,200 knowledge workers
#

38%

of IdP accounts dormant but still enabled

Veza, 2026 State of Identity & Access Report

Observed data · 2025

Method and full statement

Veza's 2026 State of Identity & Access report found 38% of identity provider accounts were dormant (inactive 90+ days) but still active, up from 20% the year before.

Method
Telemetry: aggregated, anonymized analysis of millions of identities and billions of entitlements across identity providers, cloud, SaaS and data systems at hundreds of large enterprises; normalized by median/IQR
Sample
millions of identities from hundreds of large enterprises (exact count not stated)
#

87%

of anomalous cloud file exfiltration by departing employees

Proofpoint, 2024 Data Loss Landscape

Observed data · Proofpoint cloud tenants · 2024

Method and full statement

Proofpoint platform data shows departing employees caused 87% of anomalous file exfiltration among its cloud tenants over a nine-month period.

Method
Telemetry: Proofpoint Information Protection platform data across its cloud tenants
Sample
Proofpoint cloud tenants (count not stated)
#

5 hours

to offboard one employee's SaaS access

Nudge Security, Employee offboarding by the numbers

Survey · n=375 · 2023

Method and full statement

IT teams spend an average of 5 hours per departing employee offboarding cloud and SaaS access, per a 2023 Nudge Security survey.

Method
Survey of US-based IT professionals
Sample
n=375
#

83%

of ex-employees still had access to old employer's assets

Beyond Identity, Former Employees Admit to Using Continued Account Access to Harm Previous Employers

Survey · n=1,121 · 2022

Method and full statement

In a 2022 Beyond Identity survey, 83% of former employees said they still had access to the digital assets of a previous employer.

Method
Survey: 903 employees who had left a previous job (500 US, 200 UK, 203 Ireland) plus 218 US business leaders
Sample
n=1,121 (903 employees, 218 business leaders)
#
Torii data

76%

of IT leaders call offboarding a significant security threat

Torii, Offboarding Security for a Remote Workforce

Survey · 2021

Method and full statement

76% of IT leaders agree or strongly agree that employee offboarding is a significant security threat, according to Torii's 2021 survey.

Method
Survey of IT leaders
Sample
not published
#
Show all 22 stats in this section

1 in 4

organizations automate offboarding

BetterCloud, 2026 State of SaaS Report

Survey · n=525 · 2026

Method and full statement

Only 1 in 4 organizations automates offboarding, according to BetterCloud's 2026 State of SaaS report, and 18% experienced a data breach caused by an offboarded user who still had access.

Method
Survey of IT and security professionals at SaaS-first organizations
Sample
n=525
#

51%

can't properly offboard dormant SaaS accounts

Valence Security (with Cloud Security Alliance), The State of SaaS Security: Trends and Insights for 2025-2026

Survey · n=420 · 2025

Method and full statement

51% of organizations lack the ability to properly offboard dormant identities and accounts across their SaaS estate, according to Valence Security's 2025-26 State of SaaS Security research with the Cloud Security Alliance.

Method
Survey designed and run by the Cloud Security Alliance (commissioned by Valence Security) in January 2025; 420 IT and security professionals
Sample
n=420
#

88%

of orgs have stale but enabled ghost users

Varonis, 2025 State of Data Security Report

Observed data · 1,000 IT environments · 2025

Method and full statement

88% of organizations have stale but still-enabled 'ghost' user accounts, according to Varonis's 2025 State of Data Security Report.

Method
Observed data: Varonis analysis of 1,000 real-world IT environments (Microsoft 365, AWS, Box, Salesforce, Google and other SaaS/IaaS) from its data risk assessments
Sample
1,000 IT environments
#

3%

of ex-employees still hold active credentials

Veza, 2026 State of Identity & Access Report

Observed data · 2025

Method and full statement

Across enterprises Veza analyzed, 78,000 ex-employees (3% of all employees) still held active credentials.

Method
Telemetry: aggregated, anonymized analysis of millions of identities and billions of entitlements across identity providers, cloud, SaaS and data systems at hundreds of large enterprises; normalized by median/IQR
Sample
millions of identities from hundreds of large enterprises (exact count not stated)
#

8%

of IdP accounts are orphaned (no HR owner)

Veza, 2026 State of Identity & Access Report

Observed data · 2025

Method and full statement

Veza found 8% of identity provider accounts were orphaned, with no matching owner in HR systems, a 40% year-over-year increase.

Method
Telemetry: aggregated, anonymized analysis of millions of identities and billions of entitlements across identity providers, cloud, SaaS and data systems at hundreds of large enterprises; normalized by median/IQR
Sample
millions of identities from hundreds of large enterprises (exact count not stated)
#

#3

riskiest user group: departing employees

Proofpoint, 2024 Data Loss Landscape

Survey · n=600 · 2024

Method and full statement

Security professionals rank departing employees as the third riskiest category of user, per Proofpoint's 2024 Data Loss Landscape survey.

Method
Survey of 600 security professionals at organizations with 1,000+ employees in 12 countries and 17 industries
Sample
n=600
#

50%

of IT departments take 24+ hours to offboard a leaver

BetterCloud, State of SaaSOps 2024

Survey · 2024

Method and full statement

Half of IT departments take more than 24 hours to offboard departing employees, according to BetterCloud's 2024 State of SaaSOps research.

Method
Survey of IT professionals (n not stated on this page)
Sample
not stated
#

70%

hit by ineffective offboarding

Nudge Security, Employee offboarding by the numbers

Survey · n=375 · 2023

Method and full statement

70% of IT professionals have experienced the impacts of ineffective offboarding, from business disruption to unauthorized access (Nudge Security, 2023).

Method
Survey of US-based IT professionals
Sample
n=375
#

69%

need 3+ sources to find a leaver's access

Nudge Security, Employee offboarding by the numbers

Survey · n=375 · 2023

Method and full statement

69% of IT teams use three or more sources just to identify all of a departing employee's cloud and SaaS access (Nudge Security, 2023).

Method
Survey of US-based IT professionals
Sample
n=375
#

56%

used lingering access to harm a former employer

Beyond Identity, Former Employees Admit to Using Continued Account Access to Harm Previous Employers

Survey · n=1,121 · 2022

Method and full statement

Beyond Identity's 2022 survey found 56% of former employees who retained access said they had used it to harm their former employer.

Method
Survey: 903 employees who had left a previous job (500 US, 200 UK, 203 Ireland) plus 218 US business leaders
Sample
n=1,121 (903 employees, 218 business leaders)
#

24%

kept a password on purpose after leaving

Beyond Identity, Former Employees Admit to Using Continued Account Access to Harm Previous Employers

Survey · n=1,121 · 2022

Method and full statement

Nearly a quarter (24%) of former employees admitted deliberately keeping a password after leaving a job, per Beyond Identity's 2022 survey.

Method
Survey: 903 employees who had left a previous job (500 US, 200 UK, 203 Ireland) plus 218 US business leaders
Sample
n=1,121 (903 employees, 218 business leaders)
#

74%

of employers hurt by an ex-employee breach

Beyond Identity, Former Employees Admit to Using Continued Account Access to Harm Previous Employers

Survey · n=1,121 · 2022

Method and full statement

74% of business leaders surveyed by Beyond Identity said their company had been negatively impacted by a former employee breaching its digital security.

Method
Survey: 903 employees who had left a previous job (500 US, 200 UK, 203 Ireland) plus 218 US business leaders
Sample
n=1,121 (903 employees, 218 business leaders)
#

70%

of fired employees used access to cause harm

Beyond Identity, Former Employees Admit to Using Continued Account Access to Harm Previous Employers

Survey · n=1,121 · 2022

Method and full statement

Among employees who had been fired, 70% said they had intentionally caused harm using continued access, according to Beyond Identity's 2022 survey.

Method
Survey: 903 employees who had left a previous job (500 US, 200 UK, 203 Ireland) plus 218 US business leaders
Sample
n=1,121 (903 employees, 218 business leaders)
#

Permissions pile up 10 stats

2%

of granted cloud permissions actually used

Microsoft, 2024 State of Multicloud Security Risk Report

Observed data · Microsoft customer environments · 2024

Method and full statement

Microsoft found that just 2% of the permissions granted to human and workload identities were actually used in 2023.

Method
Telemetry: usage patterns across Microsoft Defender for Cloud, Security Exposure Management, Entra Permissions Management and Purview
Sample
Microsoft customer environments (count not stated)
#

88

OAuth grants per employee (31 with data access)

Nudge Security, The Hidden Risk in Your OAuth Grant Inventory (blog)

Observed data · 2026

Method and full statement

Nudge Security customers average 88 OAuth grants per employee, 31 of them carrying data-level permissions.

Method
Telemetry: Nudge Security customer data; method not stated
Sample
not stated
#

16.5%

of permissions belong to inactive users

Veza, 2026 State of Identity & Access Report

Observed data · 2025

Method and full statement

According to Veza, 16.5% of all permissions belong to inactive users, up from 12% a year earlier.

Method
Telemetry: aggregated, anonymized analysis of millions of identities and billions of entitlements across identity providers, cloud, SaaS and data systems at hundreds of large enterprises; normalized by median/IQR
Sample
millions of identities from hundreds of large enterprises (exact count not stated)
#

96,000

entitlements held by the average worker

Veza, 2026 State of Identity & Access Report

Observed data · 2025

Method and full statement

The average worker in Veza's 2026 dataset holds 96,000 entitlements.

Method
Telemetry: aggregated, anonymized analysis of millions of identities and billions of entitlements across identity providers, cloud, SaaS and data systems at hundreds of large enterprises; normalized by median/IQR
Sample
millions of identities from hundreds of large enterprises (exact count not stated)
#

27.8%

of permissions ungoverned (outside SSO/IGA)

Veza, 2026 State of Identity & Access Report

Observed data · 2025

Method and full statement

Veza reports that 'safe, compliant' permissions fell from 70% in 2024 to 55.3% in 2025, driven by ungoverned permissions rising from 5% to 27.8%.

Method
Telemetry: aggregated, anonymized analysis of millions of identities and billions of entitlements across identity providers, cloud, SaaS and data systems at hundreds of large enterprises; normalized by median/IQR
Sample
millions of identities from hundreds of large enterprises (exact count not stated)
#

3.3%

of permissions are residual (should have been revoked)

Veza, 2026 State of Identity & Access Report

Observed data · 2025

Method and full statement

Veza classed 3.3% of enterprise permissions as 'residual': access that should have been revoked after a termination, job change or finished task.

Method
Telemetry: aggregated, anonymized analysis of millions of identities and billions of entitlements across identity providers, cloud, SaaS and data systems at hundreds of large enterprises; normalized by median/IQR
Sample
millions of identities from hundreds of large enterprises (exact count not stated)
#

82%

breached via improper access or over-privileged users

ConductorOne, Future of Identity Security Report 2025

Survey · n=494 · 2025

Method and full statement

82% of security leaders say their organization suffered a cyberattack or breach in the past year due to improper access or over-privileged users, up from 77% in 2024 (ConductorOne).

Method
Survey of IT security professionals, manager level and above, at US companies with 500+ employees
Sample
n=494
#

50%+

of cloud identities had access to everything

Microsoft, 2024 State of Multicloud Security Risk Report

Observed data · Microsoft customer environments · 2024

Method and full statement

More than half of cloud identities had access to all permissions and all resources in 2023, according to Microsoft's 2024 multicloud risk report.

Method
Telemetry: usage patterns across Microsoft Defender for Cloud, Security Exposure Management, Entra Permissions Management and Purview
Sample
Microsoft customer environments (count not stated)
#
Show all 10 stats in this section

51,000+

grantable cloud permissions, up from 40,000

Microsoft, 2024 State of Multicloud Security Risk Report

Observed data · Microsoft customer environments · 2024

Method and full statement

Over 51,000 permissions can now be granted to users and workloads across major clouds, up from 40,000 in 2022, per Microsoft.

Method
Telemetry: usage patterns across Microsoft Defender for Cloud, Security Exposure Management, Entra Permissions Management and Purview
Sample
Microsoft customer environments (count not stated)
#

1%

of granted permissions used by identities

Microsoft, 2023 State of Cloud Permissions Risks

Observed data · 500+ risk assessments · 2023

Method and full statement

Microsoft's 2023 State of Cloud Permissions Risks report found identities used just 1% of the permissions they were granted, and over 60% of all identities were inactive.

Method
Telemetry: 500+ risk assessments run with Microsoft Entra Permissions Management across Azure, AWS and GCP
Sample
500+ risk assessments
#

Access requests, onboarding and reviews 20 stats

28.1%

of help desk tickets are app access requests

Fixify, 2026 IT Help Desk Benchmark Report

Observed data · 50,000+ tickets across 30+ organizations · 2026

Method and full statement

App assignment requests make up 28.1% of all IT help desk tickets, more than four times the next most common request, according to Fixify's 2026 IT Help Desk Benchmark Report.

Method
Telemetry: analysis of anonymized help desk tickets
Sample
50,000+ tickets across 30+ organizations
#

12x

growth in access requests in two years

Okta, Businesses at Work 2026

Observed data · Okta customers · 2026

Method and full statement

Access requests have surged more than 12x and access certifications more than 9x over the past two years, according to Okta's Businesses at Work 2026 report.

Method
Telemetry: anonymized Okta customer data (Businesses at Work is based on Okta Integration Network usage); method not stated on page for this figure
Sample
Okta customers (count not stated)
#

55%

of new hires lacked full access on day one

allwhere, Employee Onboarding Statistics 2026

Survey · n=200 · 2026

Method and full statement

Only 45% of employees had their accounts, software and system access fully set up on their first day; 48% said some access was missing or delayed (allwhere survey).

Method
Survey of desk workers who use a computer most of the day (10 questions)
Sample
n=200
#

16%

considered quitting over bad onboarding

allwhere, Employee Onboarding Statistics 2026

Survey · n=200 · 2026

Method and full statement

16% of employees seriously considered quitting in their first month because of a bad onboarding experience, per an allwhere survey.

Method
Survey of desk workers who use a computer most of the day (10 questions)
Sample
n=200
#

40%

of help desk tickets are access, permissions or offboarding

Fixify, 2026 IT Help Desk Benchmark Report

Observed data · 50,000+ tickets across 30+ organizations · 2026

Method and full statement

App assignment, permissions management and employee offboarding together account for 40% of all IT help desk tickets, according to Fixify's 2026 benchmark.

Method
Telemetry: analysis of anonymized help desk tickets
Sample
50,000+ tickets across 30+ organizations
#

63%

stuck at the earliest stages of identity maturity

SailPoint, 2025 Horizons of Identity Security

Survey · n=375 · 2025

Method and full statement

63% of organizations remain stuck in the earliest stages of identity security maturity, per SailPoint's 2025 Horizons of Identity Security report.

Method
Survey of global identity leaders, conducted with McKinsey
Sample
n=375
#

14%

say their last identity deployment fully succeeded

SailPoint, 2025 Horizons of Identity Security

Survey · n=375 · 2025

Method and full statement

Only 14% of organizations say their most recent identity security deployment was completely successful, and 48% ran over budget (SailPoint, 2025).

Method
Survey of global identity leaders, conducted with McKinsey
Sample
n=375
#
Show all 20 stats in this section

46%

plan AI agents for access requests and provisioning

ConductorOne, Future of Identity Security Report 2025

Survey · n=494 · 2025

Method and full statement

Access requests and account provisioning are among the top three tasks security leaders expect to hand to AI agents, cited by 46% (ConductorOne, 2025).

Method
Survey of IT security professionals, manager level and above, at US companies with 500+ employees
Sample
n=494
#

50%

say system complexity is their top IAM challenge

ConductorOne, Future of Identity Security Report 2025

Survey · n=494 · 2025

Method and full statement

Half of security leaders cite the complexity of existing systems as their biggest identity and access management challenge (ConductorOne, 2025).

Method
Survey of IT security professionals, manager level and above, at US companies with 500+ employees
Sample
n=494
#

34%

of organizations automate employee onboarding

BetterCloud, State of SaaS 2025

Survey · nearly 600 · 2025

Method and full statement

Only 40% of organizations automate offboarding and 34% automate onboarding, even though IT ranks them as top challenges, according to BetterCloud's 2025 State of SaaS report.

Method
Survey of IT professionals
Sample
nearly 600
#

54%

lack automation for identity lifecycle management

Cloud Security Alliance, State of SaaS Security Report 2025

Survey · 2025

Method and full statement

57% of organizations report fragmented SaaS administration and 54% lack automation for identity lifecycle management, according to the Cloud Security Alliance's State of SaaS Security 2025 report.

Method
Survey of security and IT professionals; sample not stated on landing page
Sample
not stated
#

42%

say timely access reviews would have prevented incidents

Identity Defined Security Alliance (IDSA), 2024 Trends in Securing Digital Identities

Survey · 520+ respondents · 2024

Method and full statement

In IDSA's 2024 study, 42% of organizations said more timely reviews of access to sensitive data could have prevented their identity incidents, and 50% pointed to privileged access reviews.

Method
Online survey of identity and security professionals at organizations with 1,000+ employees
Sample
520+ respondents
#

47%

say access policies hinder productivity

ConductorOne, Identity Security Outlook Report 2024

Survey · n=523 · 2024

Method and full statement

47% of security leaders say their identity security strategy and access policies hinder team productivity, per ConductorOne's 2024 Identity Security Outlook.

Method
Online survey of US IT professionals, director level and up, at companies with 250 to 10,000 employees
Sample
n=523
#

<1 in 3

have automated most of offboarding

Nudge Security, Employee offboarding by the numbers

Survey · n=375 · 2023

Method and full statement

Fewer than one in three IT teams have automated 75% or more of their offboarding process, per Nudge Security's 2023 survey.

Method
Survey of US-based IT professionals
Sample
n=375
#

51%

can't keep pace with access change requests

Saviynt (research by Ponemon Institute), State of Enterprise Identity

Survey · n=1,043 · 2022

Method and full statement

51% of IT and security practitioners say they cannot keep pace with the number of access change requests, per Saviynt/Ponemon research.

Method
Survey of IT and IT security practitioners in the US and EMEA
Sample
n=1,043 (627 US, 416 EMEA)
#

46%

failed a compliance requirement due to access issues

Saviynt (research by Ponemon Institute), State of Enterprise Identity

Survey · n=1,043 · 2022

Method and full statement

46% of organizations failed to comply with regulations because of access-related issues, according to Saviynt and Ponemon's 2022 study.

Method
Survey of IT and IT security practitioners in the US and EMEA
Sample
n=1,043 (627 US, 416 EMEA)
#

16%

have a fully mature IAM strategy

Saviynt (research by Ponemon Institute), State of Enterprise Identity

Survey · n=1,043 · 2022

Method and full statement

Only 16% of organizations have a fully mature IAM strategy in place (Saviynt/Ponemon, 2022).

Method
Survey of IT and IT security practitioners in the US and EMEA
Sample
n=1,043 (627 US, 416 EMEA)
#

When access goes wrong 18 stats

$19.5M

average annual cost of insider incidents

Ponemon Institute / DTEX Systems, 2026 Cost of Insider Risks Global Report

Survey · 2026

Method and full statement

The 2026 Ponemon Cost of Insider Risks report puts the average annual cost of insider security incidents at $19.5M per organization.

Method
Ponemon Institute benchmark study of insider-risk costs (sponsored by DTEX); methodology not stated on landing page (2025 edition was based on 8,306 interviews with IT and IT security professionals)
Sample
not stated on page
#

67 days

average time to contain an insider incident

Ponemon Institute / DTEX Systems, 2026 Cost of Insider Risks Global Report

Survey · 2026

Method and full statement

Insider incidents took 67 days on average to contain in Ponemon's 2026 study, down from 86 days in 2023.

Method
Ponemon Institute benchmark study of insider-risk costs (sponsored by DTEX); methodology not stated on landing page (2025 edition was based on 8,306 interviews with IT and IT security professionals)
Sample
not stated on page
#

$10.3M

annual cost of negligent insiders

Ponemon Institute / DTEX Systems, 2026 Cost of Insider Risks Global Report

Survey · 2026

Method and full statement

Negligent insiders cost organizations $10.3M a year on average, up 17% year over year, per Ponemon's 2026 Cost of Insider Risks report.

Method
Ponemon Institute benchmark study of insider-risk costs (sponsored by DTEX); methodology not stated on landing page (2025 edition was based on 8,306 interviews with IT and IT security professionals)
Sample
not stated on page
#

19%

of IT budget spent on insider risk management

Ponemon Institute / DTEX Systems, 2026 Cost of Insider Risks Global Report

Survey · 2026

Method and full statement

Organizations now allocate 19% of their IT budget to insider risk management, up from 8.2% in 2023, according to Ponemon and DTEX.

Method
Ponemon Institute benchmark study of insider-risk costs (sponsored by DTEX); methodology not stated on landing page (2025 edition was based on 8,306 interviews with IT and IT security professionals)
Sample
not stated on page
#

12%

of breaches involved internal actors

Verizon, 2026 Data Breach Investigations Report

Observed data · 22,345 breaches · 2026

Method and full statement

Internal actors were involved in 12% of breaches in Verizon's 2026 DBIR, down from 18% the year before.

Method
Breach data: VERIS-coded incidents and confirmed breaches from Verizon and its global data contributors
Sample
22,345 breaches (actor figure)
#

60%

of insider misuse breaches driven by convenience

Verizon, 2026 Data Breach Investigations Report

Observed data · 2026

Method and full statement

Deliberate privilege misuse by insiders accounted for just under 4% of breaches in the 2026 DBIR, and 60% of those were motivated by convenience rather than money.

Method
Breach data: VERIS-coded incidents and confirmed breaches from Verizon and its global data contributors
Sample
1,141 incidents, 766 with confirmed data disclosure
#

19%

of insider breach actors were system admins

Verizon, 2026 Data Breach Investigations Report

Observed data · 1,000 breaches with internal actors · 2026

Method and full statement

End-users made up 75% of internal actors in breaches, and system administrators 19%, per Verizon's 2026 DBIR.

Method
Breach data: VERIS-coded incidents and confirmed breaches from Verizon and its global data contributors
Sample
1,000 breaches with internal actors
#

4%

of breaches were deliberate insider privilege misuse

Verizon, 2026 Data Breach Investigations Report

Observed data · 22,000+ breaches · 2026

Method and full statement

Verizon's 2026 DBIR notes that insiders walking off with proprietary data are 'frequently the hardest to catch without specific offboarding processes in place.'

Method
Breach data: VERIS-coded incidents and confirmed breaches from Verizon and its global data contributors
Sample
22,000+ breaches
#
Show all 18 stats in this section

80%

had an access-related breach last year

ConductorOne (C1), 2026 Future of Identity Report

Survey · 500+ · 2026

Method and full statement

80% of IT and security leaders surveyed by ConductorOne (C1) experienced at least one access-related breach in the past year.

Method
Survey of IT and security leaders (US organizations with 1,000+ employees per press coverage)
Sample
500+ (508 per press release)
#

$211,021

spent containing each insider incident vs $37,756 monitoring

Ponemon Institute / DTEX Systems, 2025 Cost of Insider Risks Global Report

Survey · 8,306 interviews · 2025

Method and full statement

For every insider incident, companies spend about $211,021 on containment but just $37,756 on monitoring, per Ponemon's 2025 Cost of Insider Risks report.

Method
Ponemon Institute interviews with IT and IT security professionals at organizations that experienced insider incidents
Sample
8,306 interviews
#

$18.7M

annual cost when containment takes 91+ days

Ponemon Institute / DTEX Systems, 2025 Cost of Insider Risks Global Report

Survey · 8,306 interviews · 2025

Method and full statement

Insider incidents that took more than 91 days to contain cost $18.7M on average, versus $10.6M for those contained in under 31 days (Ponemon, 2025).

Method
Ponemon Institute interviews with IT and IT security professionals at organizations that experienced insider incidents
Sample
8,306 interviews
#

1%

of users cause 88% of data loss events

Proofpoint, 2024 Data Loss Landscape

Observed data · 2024

Method and full statement

Just 1% of users are responsible for 88% of data loss events, according to Proofpoint platform data.

Method
Telemetry: Proofpoint Information Protection platform data
Sample
not stated
#

85%

of organizations had a data loss incident last year

Proofpoint, 2024 Data Loss Landscape

Survey · n=600 · 2024

Method and full statement

85% of organizations surveyed by Proofpoint experienced at least one data loss incident in the past year, averaging just over 15 incidents each.

Method
Survey of 600 security professionals at organizations with 1,000+ employees in 12 countries
Sample
n=600
#

28%

rise in monthly insider data-loss events since 2021

Code42 (Mimecast), 2024 Data Exposure Report

Survey · n=700 · 2024

Method and full statement

Monthly insider-driven data exposure, loss, leak and theft events have risen 28% on average since 2021, according to Code42's 2024 Data Exposure Report, a survey of 700 US cybersecurity professionals.

Method
Survey of US cybersecurity practitioners, managers and leaders at companies with 500+ employees
Sample
n=700
#

$15M

average cost of a single insider data event

Mimecast (Code42), 2024 Data Exposure Report

Survey · n=700 · 2024

Method and full statement

Security leaders estimate an average insider-driven data event costs $15 million, per Code42's 2024 Data Exposure Report.

Method
Survey of US cybersecurity practitioners, managers and leaders at companies with 500+ employees
Sample
n=700
#

3 hours

per day spent investigating insider data events

Code42 (Mimecast), 2024 Data Exposure Report

Survey · n=700 · 2024

Method and full statement

Cybersecurity professionals surveyed for Code42's 2024 Data Exposure Report say they spend an average of 3 hours a day investigating insider-driven data events.

Method
Survey of US cybersecurity practitioners, managers and leaders at companies with 500+ employees
Sample
n=700
#

90%

had an identity-related incident last year

Identity Defined Security Alliance (IDSA), 2024 Trends in Securing Digital Identities

Survey · 520+ respondents · 2024

Method and full statement

90% of organizations experienced at least one identity-related incident in the past year, according to IDSA's 2024 research.

Method
Online survey of identity and security professionals at organizations with 1,000+ employees
Sample
520+ respondents
#

84%

saw direct business impact from identity incidents

Identity Defined Security Alliance (IDSA), 2024 Trends in Securing Digital Identities

Survey · 520+ respondents · 2024

Method and full statement

84% of organizations hit by an identity-related incident reported a direct business impact, up from 68% in 2023 (IDSA).

Method
Online survey of identity and security professionals at organizations with 1,000+ employees
Sample
520+ respondents
#

Agents & NHIs · 92 stats

AI agents and non-human identities statistics

Machine identities outnumber people many times over, and AI agents are the newest and least governed.

Machines per personFor every employee, a crowd of keys, tokens and service accounts Two sources, two methods: a survey of security leaders and observed identity data.

Sources: CyberArk, 2025 Identity Security Landscape (archived copy) · Entro Labs, NHI & Secrets Risk Report H1 2025

Machines outnumber people 5 stats

82:1

machine identities for every human

CyberArk, 2025 Identity Security Landscape archived copy

Survey · n=2,600 cybersecurity decision makers · 2025

Method and full statement

According to CyberArk's 2025 Identity Security Landscape, there are 82 machine identities for every human in organizations worldwide.

Method
Survey by Vanson Bourne of 2,600 cybersecurity decision makers at private and public sector organizations of 500+ employees in 20 countries
Sample
n=2,600 cybersecurity decision makers
#

144:1

non-human identities per human (Entro telemetry)

Entro Security, NHI & Secrets Risk Report H1 2025

Observed data · 27M+ NHIs · 2025

Method and full statement

Entro Labs found the average ratio of non-human to human identities grew from 92:1 to 144:1 in one year, a 56% jump.

Method
Telemetry: Entro Labs analysis of 27M+ NHIs and hundreds of thousands of secrets exposures across Fortune 500 and global enterprises
Sample
27M+ NHIs
#

+44%

year-over-year growth in NHIs

Entro Security, NHI & Secrets Risk Report H1 2025

Observed data · 27M+ NHIs · 2025

Method and full statement

Non-human identities grew 44% year over year from H1 2024 to H1 2025, according to Entro Labs.

Method
Telemetry: Entro Labs analysis of 27M+ NHIs and hundreds of thousands of secrets exposures across Fortune 500 and global enterprises
Sample
27M+ NHIs
#

150%

expected growth in machine identities next year

CyberArk, 2025 State of Machine Identity Security Report archived copy

Survey · n=1,201 security and IT decision-makers · 2025

Method and full statement

79% of security leaders expect the number of machine identities in their organization to grow, by as much as 150% over the next year, per CyberArk.

Method
Survey by Censuswide of security and IT decision-makers at organizations with 500+ employees in the USA, UK, Australia, France, Germany and Singapore
Sample
n=1,201 security and IT decision-makers
#

40%+

of identities are machine identities

SailPoint, Horizons of Identity Security 2024

Survey · n=350 · 2024

Method and full statement

Machine identities now make up more than 40% of all identities in an organization, per SailPoint's 2024 Horizons report.

Method
Survey of global cybersecurity senior leaders in IT, cybersecurity and risk; over half at organizations with 10,000+ employees
Sample
n=350
#

AI agents are the newest identities 27 stats

82%

found unknown AI agents in the past year

Cloud Security Alliance (commissioned by Token Security), Autonomous but Not Controlled: AI Agent Incidents Now Common in Enterprises

Survey · n=418 IT and security professionals · 2026

Method and full statement

82% of organizations discovered previously unknown AI agents in their environment in the past year, according to a 2026 Cloud Security Alliance survey.

Method
Online survey by CSA, commissioned and co-designed by Token Security
Sample
n=418 IT and security professionals
#

80%

say AI agents took unintended actions

SailPoint, AI Agents: The New Attack Surface (AI agent adoption report)

Survey · n=353 · 2025

Method and full statement

According to SailPoint's 2025 AI agent research, 80% of companies say their AI agents have taken unintended actions, such as accessing unauthorized systems.

Method
Survey conducted by Dimensional Research of technology professionals across 5 continents
Sample
n=353
#

75%

of organizations use Claude Code

Netskope Threat Labs, Netskope AI Report: 2026

Observed data · subset of Netskope customers · 2026

Method and full statement

According to Netskope's AI Report 2026, 75% of organizations use Claude Code and 58% use Codex, up from negligible adoption a year earlier.

Method
Telemetry: aggregate usage data collected by the Netskope One platform for a subset of Netskope customers
Sample
subset of Netskope customers (count not stated)
#

4x

increase in MCP traffic

Netskope Threat Labs, Netskope AI Report: 2026

Observed data · subset of Netskope customers · 2026

Method and full statement

According to Netskope's AI Report 2026, MCP traffic increased 4x as organizations connect AI systems to sensitive data stores, driving a sharp rise in downstream data policy violations.

Method
Telemetry: aggregate usage data collected by the Netskope One platform for a subset of Netskope customers
Sample
subset of Netskope customers (count not stated)
#

1 in 5

developers give AI coding agents unrestricted access

UpGuard, YOLO Mode: Hidden Risks in AI Coding Agents (press release)

Vendor or analysis · 18,000+ configuration files · 2026

Method and full statement

According to UpGuard's analysis of 18,000+ AI agent configuration files on GitHub, 1 in 5 developers have granted AI coding agents unrestricted access to perform high-risk actions without human oversight.

Method
Analysis of more than 18,000 AI agent configuration files from public GitHub repositories
Sample
18,000+ configuration files
#

50%

of agent tools can run shell commands

Reco, The State of Agent Security 2026

Observed data · 500 MCP servers · 2026

Method and full statement

According to Reco's State of Agent Security 2026, 50% of 500 published AI agent tools (MCP servers) can execute shell commands on the host machine.

Method
Reco platform telemetry, independent analysis of 500 published npm MCP servers, and the public CVE record
Sample
500 MCP servers; 260+ AI agents and apps in telemetry
#

36%

say humans approve most AI actions first

ISACA, 2026 AI Pulse Poll (preview, RSA Conference)

Survey · n=3,400+ digital trust professionals · 2026

Method and full statement

According to ISACA's 2026 AI Pulse Poll, only 36% of respondents say humans approve most AI-generated actions before execution.

Method
Global ISACA poll of digital trust professionals
Sample
n=3,400+ digital trust professionals
#
Show all 27 stats in this section

77%

comfortable letting AI act without human review

Ivanti, Ivanti 2026 cybersecurity research (agentic AI)

Survey · 2026

Method and full statement

According to Ivanti's 2026 research, 87% of security teams say adopting agentic AI is a priority, and 77% report at least some comfort allowing autonomous AI to act without human review.

Method
Survey of security professionals (details not stated in release)
Sample
not stated
#

24,008

secrets exposed in MCP config files

GitGuardian, The State of Secrets Sprawl 2026

Observed data · Billions of public GitHub commits · 2026

Method and full statement

GitGuardian found 24,008 unique secrets exposed in Model Context Protocol (MCP) configuration files on public GitHub in 2025.

Method
Telemetry: GitGuardian scan of all public GitHub commits in 2025, plus anonymized internal-repository and collaboration-tool incident data from GitGuardian customers
Sample
Billions of public GitHub commits
#

78%

have no policy for creating or removing AI identities

Cloud Security Alliance (commissioned by Oasis Security), The State of Non-Human Identity and AI Security

Survey · n=383 IT and security professionals · 2026

Method and full statement

78% of organizations have no documented, formally adopted policy for creating or removing AI identities, per the Cloud Security Alliance.

Method
Online survey by CSA, commissioned and co-designed by Oasis Security
Sample
n=383 IT and security professionals
#

21%

keep a real-time inventory of AI agents

Cloud Security Alliance (commissioned by Strata Identity), Securing Autonomous AI Agents

Survey · n=285 IT and security professionals · 2026

Method and full statement

Only 21% of organizations maintain a real-time registry or inventory of their AI agents, according to the Cloud Security Alliance.

Method
Online survey by CSA, commissioned and co-designed by Strata Identity
Sample
n=285 IT and security professionals
#

84%

doubt they'd pass an AI-agent access audit

Cloud Security Alliance (commissioned by Strata Identity), Securing Autonomous AI Agents

Survey · n=285 IT and security professionals · 2026

Method and full statement

84% of organizations doubt they could pass a compliance audit focused on AI agent behavior or access controls, per the Cloud Security Alliance.

Method
Online survey by CSA, commissioned and co-designed by Strata Identity
Sample
n=285 IT and security professionals
#

44%

use static API keys for AI agents

Cloud Security Alliance (commissioned by Strata Identity), Securing Autonomous AI Agents

Survey · n=285 IT and security professionals · 2026

Method and full statement

44% of organizations use or plan to use static API keys to authenticate AI agents, and 43% username and password combinations, per the Cloud Security Alliance.

Method
Online survey by CSA, commissioned and co-designed by Strata Identity
Sample
n=285 IT and security professionals
#

43%

run AI agents on shared service accounts

Cloud Security Alliance (commissioned by Aembit), CSA survey report on AI agent identity and access (2026)

Survey · n=228 IT and security professionals · 2026

Method and full statement

43% of organizations run AI agents on shared service accounts and 31% let agents operate under human user identities, per the Cloud Security Alliance.

Method
Online survey by CSA, commissioned and co-designed by Aembit
Sample
n=228 IT and security professionals
#

45%

treat AI agents like humans for access controls

CyberArk, Privileged access study (January 2026) archived copy

Survey · n=500 U.S. practitioners · 2026

Method and full statement

45% of organizations apply the same privileged access controls to AI agents as they do to human identities, per CyberArk.

Method
Survey by Censuswide of U.S. practitioners in PAM, identity and infrastructure roles
Sample
n=500 U.S. practitioners
#

1 in 5

companies have mature AI agent governance

Deloitte AI Institute, The State of AI in the Enterprise, 2026

Survey · n=3,235 leaders · 2026

Method and full statement

According to Deloitte, only one in five companies has a mature governance model for autonomous AI agents, even as agentic AI use is poised to rise sharply.

Method
Global survey of senior leaders (board, C-suite, president, VP and director levels), split equally between IT and line-of-business
Sample
n=3,235 leaders
#

44%

of orgs using AI agents have policies to secure them

SailPoint, AI Agents: The New Attack Surface (AI agent adoption report)

Survey · n=353 · 2025

Method and full statement

According to SailPoint's 2025 AI agent research, 82% of organizations already use AI agents, but only 44% have policies in place to secure them.

Method
Survey conducted by Dimensional Research of technology professionals across 5 continents
Sample
n=353
#

23%

had AI agents tricked into revealing credentials

SailPoint, AI Agents: The New Attack Surface (AI agent adoption report)

Survey · n=353 · 2025

Method and full statement

According to SailPoint's 2025 AI agent research, 23% of organizations reported their AI agents have been tricked into revealing access credentials.

Method
Survey conducted by Dimensional Research of technology professionals across 5 continents
Sample
n=353
#

98%

plan to expand AI agent use despite the risk

SailPoint, AI Agents: The New Attack Surface (AI agent adoption report)

Survey · n=353 · 2025

Method and full statement

According to SailPoint's 2025 AI agent research, 96% of technology professionals consider AI agents a growing risk, yet 98% of organizations plan to expand their use within the next year.

Method
Survey conducted by Dimensional Research of technology professionals across 5 continents
Sample
n=353
#

81%

of leaders expect agents in their AI strategy within 18 months

Microsoft, 2025 Work Trend Index: The Year the Frontier Firm Is Born

Survey · n=31,000 workers incl. 9,037 leaders · 2025

Method and full statement

According to Microsoft's 2025 Work Trend Index, 81% of leaders expect AI agents to be moderately or extensively integrated into their company's AI strategy in the next 12 to 18 months.

Method
Online survey by Edelman Data x Intelligence of full-time employed or self-employed knowledge workers in 31 markets (1,000 per market), plus LinkedIn and Microsoft 365 signals
Sample
n=31,000 workers incl. 9,037 leaders
#

46%

of leaders say agents fully automate workflows

Microsoft, 2025 Work Trend Index: The Year the Frontier Firm Is Born

Survey · n=31,000 workers incl. 9,037 leaders · 2025

Method and full statement

According to Microsoft's 2025 Work Trend Index, 46% of leaders say their companies are using AI agents to fully automate workflows or processes.

Method
Online survey by Edelman Data x Intelligence of full-time employed or self-employed knowledge workers in 31 markets (1,000 per market), plus LinkedIn and Microsoft 365 signals
Sample
n=31,000 workers incl. 9,037 leaders
#

68%

lack identity security controls for AI

CyberArk, 2025 Identity Security Landscape archived copy

Survey · n=2,600 cybersecurity decision makers · 2025

Method and full statement

68% of security decision makers surveyed by CyberArk say their organizations lack identity security controls for AI.

Method
Survey by Vanson Bourne of 2,600 cybersecurity decision makers at private and public sector organizations of 500+ employees in 20 countries
Sample
n=2,600 cybersecurity decision makers
#

72%

say AI agents riskier than machine identities

SailPoint, AI agents: The new attack surface

Survey · n=353 IT professionals · 2025

Method and full statement

72% of technology professionals say AI agents pose a greater risk than other machine identities, per SailPoint.

Method
Survey conducted by Dimensional Research of IT professionals with enterprise security responsibilities across 5 continents
Sample
n=353 IT professionals
#

53%

of MCP servers use long-lived static secrets

Astrix Security, State of MCP Server Security 2025

Observed data · 5,205 MCP server implementations · 2025

Method and full statement

Of more than 5,200 open-source MCP servers Astrix analyzed, 88% require credentials, 53% rely on long-lived static API keys or personal access tokens, and only 8.5% use OAuth.

Method
Code analysis: Astrix Research analyzed README files of 5,205 open-source MCP server repositories on GitHub with an LLM-based classifier
Sample
5,205 MCP server implementations
#

79%

of MCP servers pass API keys via env variables

Astrix Security, State of MCP Server Security 2025

Observed data · 5,205 MCP server implementations · 2025

Method and full statement

79% of MCP servers that use API keys take them from plain environment variables, according to Astrix Security.

Method
Code analysis: Astrix Research analyzed README files of 5,205 open-source MCP server repositories on GitHub with an LLM-based classifier
Sample
5,205 MCP server implementations
#

64%

of tech executives plan to deploy agentic AI within 24 months

Gartner, Gartner Survey Reveals 50% of Non-U.S. CIOs and Technology Executives Anticipate Changes to Vendor Engagement Based on Regional Factors

Survey · more than 2,500 CIOs and technology executives · 2025

Method and full statement

Gartner found that 64% of technology executives plan to deploy agentic AI within the next 24 months, while AI investment is expected to grow more than 35% year over year in a constrained IT budget environment.

Method
Survey of CIOs and technology executives
Sample
more than 2,500 CIOs and technology executives
#

Keys and tokens that never expire 28 stats

29M

secrets leaked on public GitHub in 2025

GitGuardian, The State of Secrets Sprawl 2026

Observed data · Billions of public GitHub commits · 2026

Method and full statement

GitGuardian detected about 29 million new hardcoded secrets in public GitHub commits in 2025, a 34% increase year over year and the largest single-year jump it has recorded.

Method
Telemetry: GitGuardian scan of all public GitHub commits in 2025, plus anonymized internal-repository and collaboration-tool incident data from GitGuardian customers
Sample
Billions of public GitHub commits
#

64%

of valid 2022 leaked secrets still not revoked

GitGuardian, The State of Secrets Sprawl 2026

Observed data · Billions of public GitHub commits · 2026

Method and full statement

GitGuardian found that 64% of valid secrets first detected in 2022 were still not revoked in 2026.

Method
Telemetry: GitGuardian scan of all public GitHub commits in 2025, plus anonymized internal-repository and collaboration-tool incident data from GitGuardian customers
Sample
Billions of public GitHub commits
#

59%

of AWS IAM users have keys over a year old

Datadog, State of Cloud Security 2025

Observed data · Thousands of organizations · 2025

Method and full statement

59% of AWS IAM users have an active access key older than one year, according to Datadog's 2025 State of Cloud Security.

Method
Telemetry: security posture data from a sample of thousands of organizations using AWS, Azure or Google Cloud monitored by Datadog
Sample
Thousands of organizations (exact n not stated)
#

+81%

rise in leaked AI-service secrets in 2025

GitGuardian, The State of Secrets Sprawl 2026

Observed data · Billions of public GitHub commits · 2026

Method and full statement

Leaked secrets tied to AI services rose 81% year over year in 2025, to 1,275,105, according to GitGuardian.

Method
Telemetry: GitGuardian scan of all public GitHub commits in 2025, plus anonymized internal-repository and collaboration-tool incident data from GitGuardian customers
Sample
Billions of public GitHub commits
#

6x

more likely: secrets in internal vs public repos

GitGuardian, The State of Secrets Sprawl 2026

Observed data · Billions of public GitHub commits · 2026

Method and full statement

Internal repositories are about 6 times more likely than public ones to contain hardcoded secrets, per GitGuardian.

Method
Telemetry: GitGuardian scan of all public GitHub commits in 2025, plus anonymized internal-repository and collaboration-tool incident data from GitGuardian customers
Sample
Billions of public GitHub commits
#

28%

of secret leaks start in collaboration tools

GitGuardian, The State of Secrets Sprawl 2026

Observed data · Billions of public GitHub commits · 2026

Method and full statement

About 28% of secrets-leak incidents GitGuardian found originate in collaboration and productivity tools rather than code repositories.

Method
Telemetry: GitGuardian scan of all public GitHub commits in 2025, plus anonymized internal-repository and collaboration-tool incident data from GitGuardian customers
Sample
Billions of public GitHub commits
#

2x

secret-leak rate in AI-assisted commits

GitGuardian, The State of Secrets Sprawl 2026

Observed data · Billions of public GitHub commits · 2026

Method and full statement

Claude Code-assisted commits leaked secrets at about 3.2%, roughly twice the public GitHub baseline, according to GitGuardian.

Method
Telemetry: GitGuardian scan of all public GitHub commits in 2025, plus anonymized internal-repository and collaboration-tool incident data from GitGuardian customers
Sample
Billions of public GitHub commits
#

60%

of secrets violations are long-lived credentials

GitGuardian, The State of Secrets Sprawl 2026

Observed data · Billions of public GitHub commits · 2026

Method and full statement

About 60% of secrets policy violations GitGuardian sees are long-lived credentials that persist over time.

Method
Telemetry: GitGuardian scan of all public GitHub commits in 2025, plus anonymized internal-repository and collaboration-tool incident data from GitGuardian customers
Sample
Billions of public GitHub commits
#
Show all 28 stats in this section

1.6x

faster growth of secrets than developers

GitGuardian, The State of Secrets Sprawl 2026

Observed data · Billions of public GitHub commits · 2026

Method and full statement

Since 2021, leaked secrets have grown about 1.6 times faster than the active developer population, per GitGuardian.

Method
Telemetry: GitGuardian scan of all public GitHub commits in 2025, plus anonymized internal-repository and collaboration-tool incident data from GitGuardian customers
Sample
Billions of public GitHub commits
#

14%

fully automate AI identity lifecycle

Cloud Security Alliance (commissioned by Oasis Security), The State of Non-Human Identity and AI Security

Survey · n=383 IT and security professionals · 2026

Method and full statement

Only 14% of organizations have fully automated the creation and removal of AI-related identities; 27% do it entirely by hand, per the Cloud Security Alliance.

Method
Online survey by CSA, commissioned and co-designed by Oasis Security
Sample
n=383 IT and security professionals
#

24%

take 24+ hours to revoke an exposed credential

Cloud Security Alliance (commissioned by Oasis Security), The State of Non-Human Identity and AI Security

Survey · n=383 IT and security professionals · 2026

Method and full statement

Nearly a quarter (24%) of organizations take more than 24 hours to rotate or revoke a credential after a potential exposure, per the Cloud Security Alliance.

Method
Online survey by CSA, commissioned and co-designed by Oasis Security
Sample
n=383 IT and security professionals
#

54%

find unmanaged privileged accounts and secrets weekly

CyberArk, Privileged access study (January 2026) archived copy

Survey · n=500 U.S. practitioners · 2026

Method and full statement

54% of organizations uncover unmanaged privileged accounts and secrets every week, according to a 2026 CyberArk study.

Method
Survey by Censuswide of U.S. practitioners in PAM, identity and infrastructure roles
Sample
n=500 U.S. practitioners
#

114,000

internal certificates per org, managed by 4 staff

CyberArk / Ponemon Institute, Trends in PKI Security: A Global Study of Trends, Challenges & Business Impact archived copy

Survey · n=nearly 2,000 IT and security practitioners · 2026

Method and full statement

The average organization oversees more than 114,000 internal certificates but has only four full-time staff dedicated to managing them, according to Ponemon research for CyberArk.

Method
Survey by Ponemon Institute, commissioned by CyberArk, of IT and security practitioners globally
Sample
n=nearly 2,000 IT and security practitioners
#

56%

had outages from expired certificates

CyberArk / Ponemon Institute, Trends in PKI Security: A Global Study of Trends, Challenges & Business Impact archived copy

Survey · n=nearly 2,000 IT and security practitioners · 2026

Method and full statement

56% of organizations have suffered unplanned outages due to expired certificates or configuration errors, per Ponemon research for CyberArk.

Method
Survey by Ponemon Institute, commissioned by CyberArk, of IT and security practitioners globally
Sample
n=nearly 2,000 IT and security practitioners
#

7.5%

of NHIs are 5 to 10 years old

Entro Security, NHI & Secrets Risk Report H1 2025

Observed data · 27M+ NHIs · 2025

Method and full statement

7.5% of non-human identities are 5 to 10 years old, with some exceeding a decade, per Entro Labs.

Method
Telemetry: Entro Labs analysis of 27M+ NHIs and hundreds of thousands of secrets exposures across Fortune 500 and global enterprises
Sample
27M+ NHIs
#

55%

of Google Cloud service accounts have keys over a year old

Datadog, State of Cloud Security 2025

Observed data · Thousands of organizations · 2025

Method and full statement

55% of Google Cloud service accounts have active keys older than a year, and 40% of Microsoft Entra ID applications have credentials older than a year, per Datadog.

Method
Telemetry: security posture data from a sample of thousands of organizations using AWS, Azure or Google Cloud monitored by Datadog
Sample
Thousands of organizations (exact n not stated)
#

25%

of AWS access keys are over 3 years old

Datadog, State of Cloud Security 2025

Observed data · Thousands of organizations · 2025

Method and full statement

The share of cloud access keys older than three years rose to 25% in both AWS and Google Cloud, according to Datadog.

Method
Telemetry: security posture data from a sample of thousands of organizations using AWS, Azure or Google Cloud monitored by Datadog
Sample
Thousands of organizations (exact n not stated)
#

86%

had a certificate-related outage last year

Keyfactor, Digital Trust Digest: The Automation Edition

Survey · n=450 PKI/certificate practitioners · 2025

Method and full statement

86% of companies suffered at least one outage from expired or mismanaged digital certificates in the past year, and 10% have one every week, according to Keyfactor.

Method
Survey by Wakefield Research of PKI and certificate management practitioners at companies with 1,000+ employees in North America and Europe
Sample
n=450 PKI/certificate practitioners
#

17%

have full real-time visibility of certificates

Keyfactor, Digital Trust Digest: The Automation Edition

Survey · n=450 PKI/certificate practitioners · 2025

Method and full statement

Only 17% of certificate practitioners have complete, real-time visibility across all their certificates, per Keyfactor.

Method
Survey by Wakefield Research of PKI and certificate management practitioners at companies with 1,000+ employees in North America and Europe
Sample
n=450 PKI/certificate practitioners
#

94 days

median time to fix a leaked secret

Verizon, 2025 Data Breach Investigations Report

Observed data · 12,000+ confirmed breaches · 2025

Method and full statement

The median time to remediate leaked secrets discovered in a GitHub repository was 94 days, according to Verizon's 2025 DBIR.

Method
Breach data: analysis of 22,000+ security incidents and 12,000+ confirmed breaches from Verizon and contributing organizations; secrets analysis of public code repositories
Sample
12,000+ confirmed breaches
#

50%

of leaked dev/CI-CD secrets are GitLab tokens

Verizon, 2025 Data Breach Investigations Report

Observed data · 12,000+ confirmed breaches · 2025

Method and full statement

GitLab tokens made up 50% of all development and CI/CD secrets found leaked in public code repositories, per Verizon's 2025 DBIR.

Method
Breach data: analysis of 22,000+ security incidents and 12,000+ confirmed breaches from Verizon and contributing organizations; secrets analysis of public code repositories
Sample
12,000+ confirmed breaches
#

72%

had a certificate outage in the past year

CyberArk, 2025 State of Machine Identity Security Report archived copy

Survey · n=1,201 security and IT decision-makers · 2025

Method and full statement

72% of organizations suffered at least one certificate-related outage in the past year, and 45% have one weekly, per CyberArk, up from 12% weekly in 2022.

Method
Survey by Censuswide of security and IT decision-makers at organizations with 500+ employees in the USA, UK, Australia, France, Germany and Singapore
Sample
n=1,201 security and IT decision-makers
#

45%

of NHI attacks traced to unrotated credentials

Cloud Security Alliance and Astrix Security, State of Non-Human Identity Security Survey Report

Survey · n=800+ experts · 2024

Method and full statement

Lack of credential rotation was the most common cause of NHI-related attacks (45%), ahead of inadequate monitoring (37%) and over-privileged identities (37%), per CSA and Astrix.

Method
Survey of 800+ IT and security experts, coupled with data from 2M+ NHIs monitored by Astrix in Fortune 500 companies
Sample
n=800+ experts
#

71%

of NHIs not rotated on time

Entro Security, Entro Labs NHI research security advisory (2024)

Observed data · 2024

Method and full statement

71% of non-human identities are not rotated within recommended time frames, per Entro Labs.

Method
Mixed methods: Entro proprietary platform data, secondary industry data and a survey of IT and security professionals (sizes not stated)
Sample
not stated
#

9

certificate incidents per org per year

Keyfactor, 2024 PKI & Digital Trust Report

Survey · 2024

Method and full statement

The average organization experienced nine certificate-related incidents in the past 12 months, taking 2.6 hours to identify and 2.7 hours to fix each outage, according to Keyfactor.

Method
Survey conducted with the Ponemon Institute of IT and security professionals (sample size not stated on this page)
Sample
not stated on page
#

89%

struggle to manage secrets at scale

Venafi (a CyberArk company), The Impact of Machine Identities on the State of Cloud Native Security in 2024 archived copy

Survey · n=800 security and IT decision-makers · 2024

Method and full statement

89% of organizations face challenges managing and securing secrets at scale, according to Venafi.

Method
Survey of security and IT decision-makers at large organizations in the U.S., U.K., France and Germany
Sample
n=800 security and IT decision-makers
#

40%

of workload identities inactive

Microsoft, 2024 State of Multicloud Security Risk Report

Observed data · Microsoft customer environments · 2024

Method and full statement

40% of workload identities were inactive in 2023, according to Microsoft Entra Permissions Management data.

Method
Telemetry: usage patterns across Microsoft Defender for Cloud, Security Exposure Management, Entra Permissions Management and Purview
Sample
Microsoft customer environments (count not stated)
#

Too much access, too little ownership 32 stats

1%

have fully adopted just-in-time privileged access

CyberArk, Privileged access study (January 2026) archived copy

Survey · n=500 U.S. practitioners · 2026

Method and full statement

Only 1% of organizations have fully implemented just-in-time privileged access, and 91% say at least half of their privileged access is always on, per CyberArk.

Method
Survey by Censuswide of U.S. practitioners in PAM, identity and infrastructure roles
Sample
n=500 U.S. practitioners
#

59%

of compromised machines were CI/CD runners

GitGuardian, The State of Secrets Sprawl 2026

Observed data · Machines compromised in Shai-Hulud 2 · 2026

Method and full statement

In the Shai-Hulud 2 supply-chain attack, 59% of compromised machines were CI/CD runners rather than personal workstations, GitGuardian found.

Method
Telemetry: GitGuardian analysis of machines compromised in the Shai-Hulud 2 npm supply-chain attack (secrets exfiltrated to public repos)
Sample
Machines compromised in Shai-Hulud 2 (count not stated on page)
#

79%

lack high confidence in stopping NHI attacks

Cloud Security Alliance (commissioned by Oasis Security), The State of Non-Human Identity and AI Security

Survey · n=383 IT and security professionals · 2026

Method and full statement

79% of organizations rate their confidence in preventing attacks via non-human identities as low or moderate, per a 2026 Cloud Security Alliance survey commissioned by Oasis Security.

Method
Online survey by CSA, commissioned and co-designed by Oasis Security
Sample
n=383 IT and security professionals
#

92%

doubt legacy IAM can handle AI and NHIs

Cloud Security Alliance (commissioned by Oasis Security), The State of Non-Human Identity and AI Security

Survey · n=383 IT and security professionals · 2026

Method and full statement

92% of IT and security professionals are not confident their legacy IAM tools can manage the risks of AI and non-human identities, per the Cloud Security Alliance.

Method
Online survey by CSA, commissioned and co-designed by Oasis Security
Sample
n=383 IT and security professionals
#

18%

highly confident IAM can manage AI agents

Cloud Security Alliance (commissioned by Strata Identity), Securing Autonomous AI Agents

Survey · n=285 IT and security professionals · 2026

Method and full statement

Only 18% of security professionals are highly confident their IAM systems can manage AI agent identities, per the Cloud Security Alliance.

Method
Online survey by CSA, commissioned and co-designed by Strata Identity
Sample
n=285 IT and security professionals
#

65%

had an AI agent incident in the past year

Cloud Security Alliance (commissioned by Token Security), Autonomous but Not Controlled: AI Agent Incidents Now Common in Enterprises

Survey · n=418 IT and security professionals · 2026

Method and full statement

65% of organizations experienced an AI agent-related incident in the past 12 months, with 61% reporting data exposure, per the Cloud Security Alliance.

Method
Online survey by CSA, commissioned and co-designed by Token Security
Sample
n=418 IT and security professionals
#
Show all 32 stats in this section

53%

had AI agents exceed their permissions

Cloud Security Alliance (commissioned by Zenity), Enterprise AI Security Starts with AI Agents

Survey · n=445 IT and security professionals · 2026

Method and full statement

53% of organizations have had AI agents exceed their intended permissions, and only 8% say their agents never do, according to the Cloud Security Alliance.

Method
Online survey by CSA, commissioned and co-designed by Zenity
Sample
n=445 IT and security professionals
#

54%

have up to 100 unsanctioned AI agents

Cloud Security Alliance (commissioned by Zenity), Enterprise AI Security Starts with AI Agents

Survey · n=445 IT and security professionals · 2026

Method and full statement

54% of organizations report between 1 and 100 unsanctioned AI agents, and only 15% say most of their agents have a defined owner, per the Cloud Security Alliance.

Method
Online survey by CSA, commissioned and co-designed by Zenity
Sample
n=445 IT and security professionals
#

<50%

of orgs actively secure non-human identities

IBM, Cost of a Data Breach Report 2026

Survey · 602 breached organizations · 2026

Method and full statement

Fewer than half of organizations are actively securing non-human identities, according to IBM's 2026 Cost of a Data Breach Report.

Method
Ponemon Institute research (sponsored and analyzed by IBM) on breaches at 602 organizations globally, March 2025 to February 2026
Sample
602 breached organizations
#

10%

have a strategy for governing non-human identities

Okta, Businesses at Work 2026

Survey · 2026

Method and full statement

78% of organizations cite controlling non-human identity access and permissions as a top concern, but only 10% have a strategy for governing them (Okta, 2026).

Method
method not stated (likely survey within report)
Sample
not stated
#

42%

of machine identities have privileged or sensitive access

CyberArk, 2025 Identity Security Landscape archived copy

Survey · n=2,600 cybersecurity decision makers · 2025

Method and full statement

CyberArk's 2025 Identity Security Landscape found that 42% of machine identities have privileged or sensitive access.

Method
Survey by Vanson Bourne of 2,600 cybersecurity decision makers at private and public sector organizations of 500+ employees in 20 countries
Sample
n=2,600 cybersecurity decision makers
#

88%

define 'privileged user' as humans only

CyberArk, 2025 Identity Security Landscape archived copy

Survey · n=2,600 cybersecurity decision makers · 2025

Method and full statement

88% of security decision makers told CyberArk that their organization defines a 'privileged user' as human identities only.

Method
Survey by Vanson Bourne of 2,600 cybersecurity decision makers at private and public sector organizations of 500+ employees in 20 countries
Sample
n=2,600 cybersecurity decision makers
#

87%

had 2+ identity-centric breaches in a year

CyberArk, 2025 Identity Security Landscape archived copy

Survey · n=2,600 cybersecurity decision makers · 2025

Method and full statement

87% of organizations surveyed by CyberArk experienced at least two successful identity-centric breaches in the past 12 months.

Method
Survey by Vanson Bourne of 2,600 cybersecurity decision makers at private and public sector organizations of 500+ employees in 20 countries
Sample
n=2,600 cybersecurity decision makers
#

61%

lack identity controls for cloud workloads

CyberArk, 2025 Identity Security Landscape archived copy

Survey · n=2,600 cybersecurity decision makers · 2025

Method and full statement

61% of organizations surveyed by CyberArk do not have identity security controls in place to secure cloud infrastructure and workloads.

Method
Survey by Vanson Bourne of 2,600 cybersecurity decision makers at private and public sector organizations of 500+ employees in 20 countries
Sample
n=2,600 cybersecurity decision makers
#

1 in 20

AWS machine identities have full admin

Entro Security, NHI & Secrets Risk Report H1 2025

Observed data · 27M+ NHIs · 2025

Method and full statement

1 in 20 AWS machine identities carries full-admin privileges, according to Entro Labs.

Method
Telemetry: Entro Labs analysis of 27M+ NHIs and hundreds of thousands of secrets exposures across Fortune 500 and global enterprises
Sample
27M+ NHIs
#

8.7%

of NHIs are overprivileged and idle

Entro Security, NHI & Secrets Risk Report H1 2025

Observed data · 27M+ NHIs · 2025

Method and full statement

Entro Labs found 8.7% of non-human identities are both overprivileged and idle.

Method
Telemetry: Entro Labs analysis of 27M+ NHIs and hundreds of thousands of secrets exposures across Fortune 500 and global enterprises
Sample
27M+ NHIs
#

12.2%

of third-party cloud integrations dangerously overprivileged

Datadog, State of Cloud Security 2025

Observed data · Thousands of organizations · 2025

Method and full statement

12.2% of third-party integrations into AWS accounts are dangerously overprivileged, letting the vendor access all data or take over the account, per Datadog.

Method
Telemetry: security posture data from a sample of thousands of organizations using AWS, Azure or Google Cloud monitored by Datadog
Sample
Thousands of organizations (exact n not stated)
#

13

third-party integration roles per org in AWS

Datadog, State of Cloud Security 2025

Observed data · Thousands of organizations · 2025

Method and full statement

The average organization deploys 13 third-party SaaS integration roles in AWS, up from 10.2 in 2024, per Datadog.

Method
Telemetry: security posture data from a sample of thousands of organizations using AWS, Azure or Google Cloud monitored by Datadog
Sample
Thousands of organizations (exact n not stated)
#

19.4%

of EC2 instances overprivileged

Datadog, State of Cloud Security 2025

Observed data · Thousands of organizations · 2025

Method and full statement

Almost one in five AWS EC2 instances (19.4%) is overprivileged, according to Datadog.

Method
Telemetry: security posture data from a sample of thousands of organizations using AWS, Azure or Google Cloud monitored by Datadog
Sample
Thousands of organizations (exact n not stated)
#

50%

had incidents from compromised machine identities

CyberArk, 2025 State of Machine Identity Security Report archived copy

Survey · n=1,201 security and IT decision-makers · 2025

Method and full statement

Half (50%) of security leaders reported security incidents or breaches linked to compromised machine identities in the past year, according to CyberArk's 2025 State of Machine Identity Security Report.

Method
Survey by Censuswide of security and IT decision-makers at organizations with 500+ employees in the USA, UK, Australia, France, Germany and Singapore
Sample
n=1,201 security and IT decision-makers
#

53%

say security owns machine identity risk

CyberArk, 2025 State of Machine Identity Security Report archived copy

Survey · n=1,201 security and IT decision-makers · 2025

Method and full statement

Responsibility for preventing machine identity compromises is split among security (53%), development (28%) and platform (14%) teams, per CyberArk.

Method
Survey by Censuswide of security and IT decision-makers at organizations with 500+ employees in the USA, UK, Australia, France, Germany and Singapore
Sample
n=1,201 security and IT decision-makers
#

46%

struggle to monitor NHIs in SaaS

Cloud Security Alliance, State of SaaS Security Report: Trends and Insights for 2025-2026

Survey · n=420 IT and security professionals · 2025

Method and full statement

46% of organizations struggle to monitor non-human identities created by SaaS-to-SaaS integrations and GenAI tools, and 56% worry about over-privileged API access, per the Cloud Security Alliance.

Method
Online survey by CSA of IT and security professionals at large organizations
Sample
n=420 IT and security professionals
#

1 in 5

organizations had an NHI security incident

Cloud Security Alliance and Astrix Security, State of Non-Human Identity Security Survey Report

Survey · n=800+ experts · 2024

Method and full statement

Nearly 1 in 5 organizations have experienced a security incident related to non-human identities, according to a 2024 Cloud Security Alliance and Astrix survey.

Method
Survey of 800+ IT and security experts, coupled with data from 2M+ NHIs monitored by Astrix in Fortune 500 companies
Sample
n=800+ experts
#

15%

highly confident they can secure NHIs

Cloud Security Alliance and Astrix Security, State of Non-Human Identity Security Survey Report

Survey · n=800+ experts · 2024

Method and full statement

Only 15% of organizations are highly confident in their ability to secure non-human identities, versus nearly 1 in 4 for human identities, per CSA and Astrix.

Method
Survey of 800+ IT and security experts, coupled with data from 2M+ NHIs monitored by Astrix in Fortune 500 companies
Sample
n=800+ experts
#

85%

lack full visibility into OAuth-connected vendors

Cloud Security Alliance and Astrix Security, State of Non-Human Identity Security Survey Report

Survey · n=800+ experts · 2024

Method and full statement

38% of organizations report no or low visibility into third-party vendors connected by OAuth apps, and another 47% have only partial visibility, according to CSA and Astrix.

Method
Survey of 800+ IT and security experts, coupled with data from 2M+ NHIs monitored by Astrix in Fortune 500 companies
Sample
n=800+ experts
#

97%

of NHIs have excessive privileges

Entro Security, Entro Labs NHI research security advisory (2024)

Observed data · 2024

Method and full statement

Entro Labs found 97% of non-human identities have excessive privileges, and 92% of organizations expose NHIs to third parties.

Method
Mixed methods: Entro proprietary platform data, secondary industry data and a survey of IT and security professionals (sizes not stated)
Sample
not stated
#

91%

of former employees' tokens remain active

Entro Security, Entro Labs NHI research security advisory (2024)

Observed data · 2024

Method and full statement

91% of former employees' tokens remain active after they leave, according to Entro Labs.

Method
Mixed methods: Entro proprietary platform data, secondary industry data and a survey of IT and security professionals (sizes not stated)
Sample
not stated
#

56%

had a service-account machine identity incident

Venafi (a CyberArk company), The Impact of Machine Identities on the State of Cloud Native Security in 2024 archived copy

Survey · n=800 security and IT decision-makers · 2024

Method and full statement

56% of organizations had a security incident involving machine identities such as access tokens used with service accounts in the past year, according to Venafi.

Method
Survey of security and IT decision-makers at large organizations in the U.S., U.K., France and Germany
Sample
n=800 security and IT decision-makers
#

88%

say tokens and service accounts are attackers' next target

Venafi (a CyberArk company), The Impact of Machine Identities on the State of Cloud Native Security in 2024 archived copy

Survey · n=800 security and IT decision-makers · 2024

Method and full statement

88% of security leaders believe machine identities, specifically access tokens and their connected service accounts, are the next big target for attackers, per Venafi.

Method
Survey of security and IT decision-makers at large organizations in the U.S., U.K., France and Germany
Sample
n=800 security and IT decision-makers
#

Security · 72 stats

SaaS security and breaches statistics

Most SaaS breaches start with a login, not an exploit, and often through a connected third party.

Attackers log in, they don't break in 19 stats

83%

of cloud and SaaS incidents began with identity compromise

Google Cloud, Cloud Threat Horizons Report H1 2026

Observed data · Mandiant IR and MTD engagements · 2026

Method and full statement

Threat actors exploited identity issues to gain initial access in 83% of incidents involving major cloud and SaaS-hosted environments, according to Google Cloud's H1 2026 Threat Horizons Report.

Method
Incident response data: Mandiant Incident Response and Mandiant Threat Defense engagements in H2 2025 involving major cloud and SaaS-hosted environments
Sample
Mandiant IR and MTD engagements (count not stated)
#

99%

of SaaS compromises started at the identity provider

Obsidian Security, 2025 SaaS Security Threat Report

Observed data · 150+ incident responses · 2025

Method and full statement

99% of SaaS compromises Obsidian Security investigated originated at the identity provider, according to its 2025 SaaS Security Threat Report.

Method
Incident response data: 150+ incident responses Obsidian took part in alongside GuidePoint and Kroll
Sample
150+ incident responses
#

97%

of identity attacks are password attacks

Microsoft, Microsoft Digital Defense Report 2025

Observed data · Microsoft telemetry · 2025

Method and full statement

More than 97% of identity attacks are password attacks, according to Microsoft's 2025 Digital Defense Report.

Method
Telemetry: Microsoft threat intelligence signals (100+ trillion daily) and incident response engagements, July 2024 to June 2025
Sample
Microsoft telemetry (not a sample)
#

39%

of breaches involve credential abuse

Verizon, 2026 Data Breach Investigations Report

Observed data · 22,624 confirmed breaches · 2026

Method and full statement

Counting every stage of an attack, credential abuse appears in 39% of breaches, the most common action, according to Verizon's 2026 DBIR.

Method
Breach data: analysis of 31,000+ security incidents, 22,000+ confirmed breaches in 145 countries, from Verizon and contributing organizations
Sample
22,624 confirmed breaches
#

31%

of breaches began with vulnerability exploitation

Verizon, 2026 Data Breach Investigations Report

Observed data · 2026

Method and full statement

For the first time in the DBIR's history, vulnerability exploitation (31% of breaches) overtook credential abuse (13%) as the most common way attackers get in, per Verizon's 2026 report.

Method
Breach data: Verizon VTRAC caseload plus contributor data (law enforcement, forensic firms, insurers, ISACs) across 145 countries; 31,000+ incidents and 22,000+ confirmed breaches
Sample
n=19,905 non-Error, non-Misuse breaches with known initial access vector
#

95 days

median gap from credential leak to ransomware

Verizon, 2026 Data Breach Investigations Report

Observed data · n=4,395 credential leakage events · 2026

Method and full statement

Half of ransomware victims with a prior credential or infostealer leak had that leak within 95 days of the attack, per Verizon's 2026 DBIR.

Method
Correlation of publicized ransomware victims against infostealer logs and credential-leak data
Sample
n=4,395 credential leakage events
#

20

credential leak events a year at larger orgs

Verizon, 2026 Data Breach Investigations Report

Observed data · 2026

Method and full statement

Small organizations saw a median of seven credential leak events a year and larger organizations around 20, according to Verizon's 2026 DBIR.

Method
Infostealer and credential-leak monitoring data contributed to the DBIR
Sample
not stated
#

82%

of detections were malware-free

CrowdStrike, 2026 Global Threat Report

Observed data · CrowdStrike Falcon detections · 2026

Method and full statement

82% of CrowdStrike detections in 2025 were malware-free, as adversaries used valid credentials, trusted identity flows and approved SaaS integrations.

Method
Threat intelligence and incident telemetry: CrowdStrike Counter Adversary Operations tracking of 280+ adversaries and Falcon platform detections during calendar 2025
Sample
CrowdStrike Falcon detections (count not stated)
#
Show all 19 stats in this section

35%

of cloud incidents involved valid account abuse

CrowdStrike, 2026 Global Threat Report

Observed data · CrowdStrike-observed cloud incidents · 2026

Method and full statement

Valid account abuse accounted for 35% of cloud incidents in 2025, and cloud-conscious intrusions rose 37%, according to CrowdStrike's 2026 Global Threat Report.

Method
Threat intelligence and incident telemetry: CrowdStrike Counter Adversary Operations tracking of 280+ adversaries and Falcon platform detections during calendar 2025
Sample
CrowdStrike-observed cloud incidents (count not stated)
#

23%

of cloud compromises began with voice phishing

Google Cloud (Mandiant), M-Trends 2026

Observed data · Mandiant investigations · 2026

Method and full statement

Voice phishing was the number one initial infection vector in cloud-related compromises in 2025, at 23%, according to Mandiant's M-Trends 2026.

Method
Incident response data: Mandiant Consulting investigations of targeted attack activity between Jan 1 and Dec 31, 2025 (500k+ investigation hours)
Sample
Mandiant investigations (count not stated)
#

52.2%

of valid-account intrusions led to more credential theft

Microsoft, Microsoft Digital Defense Report 2026

Observed data · 2026

Method and full statement

52.2% of intrusions that used a valid account went on to steal more credentials, according to Microsoft's 2026 Digital Defense Report.

Method
Telemetry and incident data: Microsoft Threat Intelligence observations
Sample
not stated
#

78%

of attacks on critical infrastructure used cloud identity abuse

Microsoft, Microsoft Digital Defense Report 2026

Observed data · 2026

Method and full statement

78% of observed attack techniques against critical infrastructure used cloud identity abuse, according to Microsoft's 2026 Digital Defense Report.

Method
Telemetry and incident data: Microsoft Threat Intelligence observations
Sample
not stated
#

36%

of breaches used stolen credentials

Verizon, 2026 Data Breach Investigations Report

Observed data · 19,550 breaches · 2026

Method and full statement

The use of stolen credentials appeared in 36% of breaches in the 2026 Verizon DBIR.

Method
Breach data: VERIS-coded incidents and confirmed breaches from Verizon and its global data contributors
Sample
19,550 breaches (action varieties figure)
#

80%

of Snowflake-attack accounts had prior credential exposure

Verizon, 2025 Data Breach Investigations Report

Observed data · 12,000+ confirmed breaches · 2025

Method and full statement

In the 2024 Snowflake customer breaches, about 80% of the accounts the attacker used had prior credential exposure, and around 165 organizations were affected, per Verizon's 2025 DBIR.

Method
Breach data: analysis of 22,000+ security incidents and 12,000+ confirmed breaches from Verizon and contributing organizations; secrets analysis of public code repositories
Sample
12,000+ confirmed breaches
#

22%

of breaches started with credential abuse

Verizon, 2025 Data Breach Investigations Report

Observed data · 12,195 confirmed breaches · 2025

Method and full statement

Credential abuse (22%) was the leading initial attack vector in Verizon's 2025 DBIR, just ahead of vulnerability exploitation (20%).

Method
Breach data: Verizon VTRAC caseload plus global contributor data; 22,052 incidents including 12,195 confirmed breaches
Sample
12,195 confirmed breaches
#

54%

of ransomware victims' domains were in credential dumps

Verizon, 2025 Data Breach Investigations Report

Observed data · 2025

Method and full statement

54% of 2024 ransomware victims had their domains appear in infostealer credential dumps, per Verizon's 2025 DBIR.

Method
Correlation of infostealer logs and marketplace postings with domains of victims disclosed by ransomware actors in 2024
Sample
not stated
#

53%

of material breaches traced to compromised credentials

1Password, 2025 Annual Report: The Access-Trust Gap

Survey · n=5,200 · 2025

Method and full statement

Compromised credentials were the root cause of 53% of material breaches over the past three years, according to 1Password's 2025 Access-Trust Gap report.

Method
Online survey of 5,200 desk-based knowledge workers (including IT and security professionals) in the US, Canada, UK, Germany, France and Singapore
Sample
n=5,200 (security respondents subset)
#

32%

rise in identity-based attacks, H1 2025

Microsoft, Microsoft Digital Defense Report 2025

Observed data · 2025

Method and full statement

Identity-based attacks rose 32% in the first half of 2025, according to Microsoft.

Method
Telemetry: Microsoft security signals
Sample
not stated
#

79.7%

of abused Snowflake accounts had previously leaked credentials

Google Cloud (Mandiant), UNC5537 Targets Snowflake Customer Instances for Data Theft and Extortion

Observed data · Accounts leveraged in the campaign · 2024

Method and full statement

At least 79.7% of the Snowflake customer accounts used in the 2024 UNC5537 campaign had prior credential exposure, much of it from infostealer infections dating back to 2020, Mandiant found.

Method
Mandiant and Snowflake joint analysis of accounts used by the threat actor against infostealer data
Sample
Accounts leveraged in the campaign (count not stated)
#

Every connected app is a door 14 stats

48%

of breaches involved a third party

Verizon, 2026 Data Breach Investigations Report

Observed data · 22,624 confirmed breaches · 2026

Method and full statement

Breaches with third-party involvement rose 60% year over year to 48% of all breaches, according to Verizon's 2026 DBIR.

Method
Breach data: analysis of 31,000+ security incidents, 22,000+ confirmed breaches in 145 countries, from Verizon and contributing organizations
Sample
22,624 confirmed breaches
#

700+

companies hit through one compromised SaaS integration

Obsidian Security, The rise of SaaS supply chain attacks (blog)

Observed data · 2025

Method and full statement

The 2025 Salesloft Drift OAuth token compromise extended into Salesforce and other tools at more than 700 companies, according to Obsidian Security.

Method
Obsidian incident analysis of the Salesloft Drift campaign
Sample
not stated
#

~8 months

to fix half of third-party cloud credential issues

Verizon, 2026 Data Breach Investigations Report

Observed data · 22,624 confirmed breaches · 2026

Method and full statement

For weak passwords and permission misconfigurations in third parties' cloud accounts, it took almost eight months to resolve half of all findings, per Verizon's 2026 DBIR.

Method
Breach data: analysis of 31,000+ security incidents, 22,000+ confirmed breaches in 145 countries, from Verizon and contributing organizations
Sample
22,624 confirmed breaches
#

21%

of cloud intrusions came through a compromised third party

Google Cloud, Cloud Threat Horizons Report H1 2026

Observed data · Mandiant IR and MTD engagements · 2026

Method and full statement

21% of cloud and SaaS intrusions in the second half of 2025 involved compromised trusted relationships with third parties, such as stolen Salesloft Drift and Gainsight OAuth tokens, per Google Cloud's H1 2026 Threat Horizons Report.

Method
Incident response data: Mandiant Incident Response and Mandiant Threat Defense engagements in H2 2025 involving major cloud and SaaS-hosted environments
Sample
Mandiant IR and MTD engagements (count not stated)
#

78%

cover less than half their vendors

SecurityScorecard, 2026 Supply Chain Cybersecurity Trends Report

Survey · 2026

Method and full statement

78% of organizations say their cybersecurity programs cover less than half of their vendor ecosystem, according to SecurityScorecard's 2026 Supply Chain Cybersecurity Trends Report.

Method
Survey of 'hundreds of professionals managing vendor risk' (exact n not stated on page)
Sample
not stated (hundreds)
#

2x

third-party share of breaches doubled to 30%

Verizon, 2025 Data Breach Investigations Report

Observed data · 12,195 confirmed breaches · 2025

Method and full statement

Third-party involvement in breaches doubled in a year, from 15% to 30%, according to Verizon's 2025 Data Breach Investigations Report.

Method
Breach data: Verizon VTRAC caseload plus global contributor data; 22,052 incidents including 12,195 confirmed breaches
Sample
12,195 confirmed breaches
#

123%

growth in SaaS-to-SaaS integrations

Obsidian Security, The rise of SaaS supply chain attacks (blog)

Observed data · 2025

Method and full statement

SaaS integrations created in Obsidian Security's network grew 123% and AI agents created grew 223%, widening the SaaS supply chain attack surface.

Method
Telemetry: Obsidian customer network data
Sample
not stated
#
Show all 14 stats in this section

10x

bigger blast radius than direct Salesforce attacks

Obsidian Security, The rise of SaaS supply chain attacks (blog)

Observed data · 2025

Method and full statement

Obsidian Security found the blast radius of the Salesloft Drift supply chain attack was 10 times greater than previous incidents in which attackers went after Salesforce directly.

Method
Obsidian incident analysis comparing campaigns
Sample
not stated
#

35.5%

of 2024 breaches were third-party related

SecurityScorecard, 2025 Global Third-Party Breach Report

Observed data · 1,000 breaches · 2025

Method and full statement

35.5% of all breaches in 2024 were third-party related, according to SecurityScorecard's 2025 Global Third-Party Breach Report.

Method
Breach data: SecurityScorecard STRIKE Threat Intelligence analysis of 1,000 publicly reported breaches from 2024 across industries and regions
Sample
1,000 breaches
#

41.4%

of ransomware attacks start through a third party

SecurityScorecard, 2025 Global Third-Party Breach Report

Observed data · 1,000 breaches · 2025

Method and full statement

41.4% of ransomware attacks now start through third parties, according to SecurityScorecard's 2025 Global Third-Party Breach Report.

Method
Breach data: SecurityScorecard STRIKE Threat Intelligence analysis of 1,000 publicly reported breaches from 2024 across industries and regions
Sample
1,000 breaches (ransomware subset)
#

70%+

had a material third-party cyber incident last year

SecurityScorecard, 2025 Supply Chain Cybersecurity Trends Survey

Survey · n=546 · 2025

Method and full statement

More than 70% of organizations had at least one material third-party cybersecurity incident in the past year, according to SecurityScorecard's 2025 Supply Chain Cybersecurity Trends survey.

Method
Survey of 546 IT directors and above whose roles involve cybersecurity, enterprise organizations worldwide
Sample
n=546
#

1,000+

apps connected to the average Microsoft 365 tenant

AppOmni, The State of SaaS Security 2024

Survey · n=644 · 2024

Method and full statement

49% of frequent Microsoft 365 users thought fewer than 10 apps were connected to their tenant; AppOmni's platform data shows more than 1,000 connections on average.

Method
Survey of security decision makers at 644 organizations in the US, UK, France, Germany, Japan and Australia (nearly half with 2,500+ employees), plus AppOmni aggregated platform data
Sample
n=644 (survey); AppOmni customer data (size not stated)
#

33%

of third-party SaaS integrations hold sensitive permissions

Valence Security, 2024 State of SaaS Security Report

Observed data · Hundreds of enterprise SaaS applications · 2024

Method and full statement

Every organization in Valence Security's 2024 data granted API access to at least one third-party vendor, and 33% of those integrations had access to sensitive permissions and data.

Method
EMA survey of 125 security executives, plus anonymized 2024 data from hundreds of enterprise SaaS applications monitored by the Valence platform
Sample
Hundreds of enterprise SaaS applications (platform data)
#

99%

of Global 2000 firms connect to a breached vendor

SecurityScorecard and Cyentia Institute, Global 2000 supply chain research

Observed data · Global 2000 companies · 2024

Method and full statement

99% of Global 2000 companies are directly connected to vendors that have had a recent breach, and supply chain incidents cost 17 times more to remediate than first-party breaches, according to SecurityScorecard and the Cyentia Institute.

Method
Observed data: SecurityScorecard vendor-relationship and breach data for Global 2000 companies, analyzed with the Cyentia Institute
Sample
Global 2000 companies
#

The MFA and SSO gaps 12 stats

34%

of SaaS apps are not protected by SSO

1Password, Annual Report 2025: The Access-Trust Gap

Survey · n=5,200 knowledge workers · 2025

Method and full statement

1Password's 2025 report found at least one-third (34%) of SaaS apps are not protected by single sign-on.

Method
Survey: online survey of 5,200 desk-based knowledge workers (including IT and security professionals) in the U.S., Canada, UK, Germany, France and Singapore; figure reported by IT/security respondents
Sample
n=5,200 knowledge workers
#

23%

of third parties fully fixed cloud MFA gaps

Verizon, 2026 Data Breach Investigations Report

Observed data · n=7,513 third-party cloud MFA exposures · 2026

Method and full statement

Only 23% of third-party organizations fully remediated missing or weak MFA on their cloud accounts, according to Verizon's 2026 DBIR.

Method
Observed data: resolution times of exposures collected from inside third-party cloud environments by a third-party cyber risk management research partner
Sample
n=7,513 third-party cloud MFA exposures
#

37%

of orgs had an IaaS admin account without MFA

Verizon, 2026 Data Breach Investigations Report

Observed data · 2026

Method and full statement

In a cloud exposure snapshot in Verizon's 2026 DBIR, 37% of organizations had an admin account with MFA disabled on an IaaS platform, versus 14% on Snowflake after its 2024 breach campaign.

Method
Observed data: point-in-time snapshot from a cloud exposure dataset (contributor data)
Sample
not stated
#

46%

of SaaS breaches tied to weak or exploited MFA

Valence Security, The State of SaaS Security: Trends and Insights for 2026

Survey · 2026

Method and full statement

46% of SaaS breaches were linked to weak or exploited MFA protections, according to Valence Security's State of SaaS Security: Trends and Insights for 2026.

Method
method not stated
Sample
not stated
#

31%

of MFA-bypass attacks used token theft

Verizon, 2025 Data Breach Investigations Report

Observed data · n=2,102 Microsoft 365 MFA bypass attacks · 2025

Method and full statement

Token theft was the most common technique in attacks that bypassed MFA on Microsoft 365 accounts, at 31%, according to Verizon's 2025 DBIR.

Method
Microsoft 365 security logs visible to a managed security services data contributor
Sample
n=2,102 Microsoft 365 MFA bypass attacks
#

84%

of SaaS breaches got past MFA

Obsidian Security, 2025 SaaS Security Threat Report

Observed data · 150+ incident responses · 2025

Method and full statement

MFA failed to prevent the attack in 84% of the SaaS incident responses Obsidian Security took part in, per its 2025 SaaS Security Threat Report.

Method
Incident response data: 150+ incident responses with GuidePoint and Kroll
Sample
150+ incident responses
#

~50%

can't enforce MFA and SSO across all SaaS apps

Valence Security (with Cloud Security Alliance), The State of SaaS Security: Trends and Insights for 2025-2026

Survey · n=420 · 2025

Method and full statement

Nearly half of organizations cannot enforce consistent MFA and single sign-on across all users and SaaS applications, according to Valence Security's 2025-26 research with the Cloud Security Alliance.

Method
Survey designed and run by the Cloud Security Alliance (commissioned by Valence Security) in January 2025; 420 IT and security professionals
Sample
n=420
#

99%

of identity attacks blocked by phishing-resistant MFA

Microsoft, Microsoft Digital Defense Report 2025

Observed data · Microsoft telemetry · 2025

Method and full statement

Phishing-resistant MFA can block more than 99% of identity-based attacks, according to Microsoft's 2025 Digital Defense Report.

Method
Telemetry: Microsoft threat intelligence signals (100+ trillion daily) and incident response engagements, July 2024 to June 2025
Sample
Microsoft telemetry
#
Show all 12 stats in this section

1 in 7

orgs don't enforce MFA across SaaS and cloud

Varonis, 2025 State of Data Security Report

Observed data · 1,000 IT environments · 2025

Method and full statement

1 in 7 organizations do not use or enforce MFA across their SaaS and multi-cloud environments, according to Varonis's 2025 State of Data Security Report.

Method
Observed data: Varonis analysis of 1,000 real-world IT environments (Microsoft 365, AWS, Box, Salesforce, Google and other SaaS/IaaS) from its data risk assessments
Sample
1,000 IT environments
#

13%

of enterprise users still lack MFA

Veza, 2026 State of Identity & Access Report

Observed data · 2025

Method and full statement

Veza found 13% of enterprise users still lack MFA, a figure that did not change year over year.

Method
Telemetry: aggregated, anonymized analysis of millions of identities and billions of entitlements across identity providers, cloud, SaaS and data systems at hundreds of large enterprises; normalized by median/IQR
Sample
millions of identities from hundreds of large enterprises (exact count not stated)
#

37%

of corporate apps not behind SSO (IT estimate)

Dashlane, Shadow IT and IT burnout survey

Survey · 1,000 U.S. employees + 500 U.S. IT leaders · 2025

Method and full statement

39% of employees use apps not managed by their company on work devices, and IT leaders estimate 37% of corporate apps are not behind single sign-on, according to Dashlane.

Method
Survey of U.S. employed adults and U.S. IT leaders
Sample
1,000 U.S. employees + 500 U.S. IT leaders
#

80%

of SSO-capable AI apps aren't behind SSO

Grip Security, 2025 SaaS Security Risks Report

Observed data · 2024

Method and full statement

80% of popular AI apps that support SAML single sign-on are not federated through it, according to Grip Security's 2025 SaaS Security Risks Report.

Method
Telemetry: anonymized data from Grip SaaS Security Control Plane deployments
Sample
29M+ SaaS user accounts, 1.7M identities, 23,987 SaaS apps
#

Data exposed by default 5 stats

73%

of cloud incidents were aimed at stealing data

Google Cloud, Cloud Threat Horizons Report H1 2026

Observed data · Mandiant IR and MTD engagements · 2026

Method and full statement

Attackers targeted data in 73% of cloud-related incidents in the second half of 2025, according to Google Cloud's H1 2026 Threat Horizons Report.

Method
Incident response data: Mandiant Incident Response and Mandiant Threat Defense engagements in H2 2025 involving major cloud and SaaS-hosted environments
Sample
Mandiant IR and MTD engagements (count not stated)
#

41%

of SaaS incidents came from permission issues

AppOmni, The State of SaaS Security 2025

Survey · n=803 · 2025

Method and full statement

41% of SaaS security incidents stemmed from permission issues and 29% from misconfigurations, according to AppOmni's 2025 report.

Method
Survey of 803 security leaders and practitioners in the US, UK, Germany, Australia and Japan (finance, healthcare, manufacturing, software); three-quarters from organizations with 2,000+ employees
Sample
n=803
#

63%

of orgs report external data oversharing in SaaS

Cloud Security Alliance (commissioned by Valence Security), State of SaaS Security Report 2025

Survey · n=420 · 2025

Method and full statement

63% of organizations report external data oversharing in their SaaS apps, according to the Cloud Security Alliance's State of SaaS Security 2025 survey.

Method
Survey designed and run by the Cloud Security Alliance (commissioned by Valence Security) in January 2025; 420 IT and security professionals
Sample
n=420
#

66%

of companies expose cloud data to anonymous users

Varonis, 2025 State of Data Security Report

Observed data · 1,000 IT environments · 2025

Method and full statement

66% of companies have cloud data exposed to anonymous users, according to Varonis's 2025 State of Data Security Report.

Method
Observed data: Varonis analysis of 1,000 real-world IT environments (Microsoft 365, AWS, Box, Salesforce, Google and other SaaS/IaaS) from its data risk assessments
Sample
1,000 IT environments
#

94%

of external SaaS data shares are inactive

Valence Security, 2024 State of SaaS Security Report

Observed data · Hundreds of enterprise SaaS applications · 2024

Method and full statement

94% of external data shares in enterprise SaaS apps are inactive, meaning outsiders keep access they no longer need, according to Valence Security's 2024 State of SaaS Security report.

Method
EMA survey of 125 security executives, plus anonymized 2024 data from hundreds of enterprise SaaS applications monitored by the Valence platform
Sample
Hundreds of enterprise SaaS applications (platform data)
#

Confident, and still breached 10 stats

75%

of orgs had a SaaS security incident last year

AppOmni, The State of SaaS Security 2025

Survey · n=803 · 2025

Method and full statement

75% of organizations had a SaaS security incident in the past year, up 33% from 2024, according to AppOmni's State of SaaS Security 2025 report.

Method
Survey of 803 security leaders and practitioners in the US, UK, Germany, Australia and Japan (finance, healthcare, manufacturing, software); three-quarters from organizations with 2,000+ employees
Sample
n=803
#

91%

are confident in SaaS security, despite incidents

AppOmni, The State of SaaS Security 2025

Survey · n=803 · 2025

Method and full statement

91% of organizations say they are confident in their SaaS security posture, even though three-quarters had a SaaS incident in the past year, per AppOmni's 2025 report.

Method
Survey of 803 security leaders and practitioners in the US, UK, Germany, Australia and Japan (finance, healthcare, manufacturing, software); three-quarters from organizations with 2,000+ employees
Sample
n=803
#

94%

of orgs had cloud intrusions that exposed data

CrowdStrike, State of Cloud Detection and Response (CDR) Survey

Survey · 2026

Method and full statement

94% of organizations report cloud intrusions that resulted in data exposure or exfiltration, according to CrowdStrike's 2026 State of Cloud Detection and Response survey.

Method
Survey; method not stated (sample size and respondent profile not given on page)
Sample
not stated
#

34%

name cloud applications a top attack target

Thales (research by S&P Global 451 Research), 2026 Data Threat Report

Survey · n=3,120 · 2026

Method and full statement

Cloud applications are among the top three attack targets for 34% of organizations, and only about half of sensitive data in the cloud is encrypted, according to Thales's 2026 Data Threat Report.

Method
Global web survey of security and IT management professionals, conducted by S&P Global 451 Research
Sample
n=3,120
#

89%

of breached orgs thought they had enough SaaS visibility

AppOmni, The State of SaaS Security 2025

Survey · Respondents whose orgs had an incident · 2025

Method and full statement

89% of organizations that suffered a SaaS incident believed they had 'appropriate visibility' into their SaaS environment, according to AppOmni's 2025 report.

Method
Survey of 803 security leaders and practitioners in the US, UK, Germany, Australia and Japan (finance, healthcare, manufacturing, software); three-quarters from organizations with 2,000+ employees
Sample
Respondents whose orgs had an incident (subset of n=803)
#

13%

of orgs use a dedicated SSPM tool

AppOmni, The State of SaaS Security 2025

Survey · n=803 · 2025

Method and full statement

Just 13% of organizations use a dedicated SaaS Security Posture Management (SSPM) tool, though nearly a third say they need one, per AppOmni's 2025 report.

Method
Survey of 803 security leaders and practitioners in the US, UK, Germany, Australia and Japan (finance, healthcare, manufacturing, software); three-quarters from organizations with 2,000+ employees
Sample
n=803
#

300%

year-over-year increase in SaaS breaches

Obsidian Security, 2025 SaaS Security Threat Report

Observed data · 150+ incident responses · 2025

Method and full statement

SaaS breaches rose 300% year over year between September 2023 and September 2024, according to Obsidian Security's 2025 SaaS Security Threat Report.

Method
Breach data: Obsidian's breach data repository and 150+ incident responses conducted with GuidePoint and Kroll
Sample
150+ incident responses
#

76%

of orgs are increasing SaaS security budgets

Cloud Security Alliance (commissioned by Valence Security), State of SaaS Security Report 2025

Survey · n=420 · 2025

Method and full statement

SaaS security is a high priority for 86% of organizations and 76% are increasing their SaaS security budgets, per the Cloud Security Alliance's 2025 survey.

Method
Survey designed and run by the Cloud Security Alliance (commissioned by Valence Security) in January 2025; 420 IT and security professionals
Sample
n=420
#
Show all 10 stats in this section

42%

lack full SaaS discovery capabilities

Valence Security (with Cloud Security Alliance), The State of SaaS Security: Trends and Insights for 2025-2026

Survey · n=420 · 2025

Method and full statement

42% of organizations lack comprehensive SaaS discovery and cannot tell whether employees are using risky GenAI apps, according to Valence Security's 2025-26 research with the Cloud Security Alliance.

Method
Survey designed and run by the Cloud Security Alliance (commissioned by Valence Security) in January 2025; 420 IT and security professionals
Sample
n=420
#

34%

don't strictly enforce their sanctioned-app policies

AppOmni, The State of SaaS Security 2024

Survey · n=644 · 2024

Method and full statement

34% of organizations with policies requiring only sanctioned SaaS apps admit those rules are not strictly enforced, up 12 points from 2023, per AppOmni's 2024 report.

Method
Survey of security decision makers at 644 organizations in the US, UK, France, Germany, Japan and Australia (nearly half with 2,500+ employees), plus AppOmni aggregated platform data
Sample
n=644
#

What a breach costs, and how fast it moves 12 stats

$4.99M

global average cost of a data breach (2026)

IBM, Cost of a Data Breach Report 2026

Survey · 602 breached organizations · 2026

Method and full statement

The global average cost of a data breach rose 12% to a record $4.99 million in IBM's 2026 Cost of a Data Breach Report.

Method
Ponemon Institute research (sponsored and analyzed by IBM) on breaches at 602 organizations globally, March 2025 to February 2026
Sample
602 breached organizations
#

247 days

average time to identify and contain a breach

IBM (reported by Help Net Security), Cost of a Data Breach Report 2026

Survey · 602 breached organizations · 2026

Method and full statement

The average time to identify and contain a breach rose to 247 days in IBM's 2026 Cost of a Data Breach Report, reversing five straight years of decline.

Method
Ponemon Institute research (sponsored and analyzed by IBM) on breaches at 602 organizations globally, March 2025 to February 2026
Sample
602 breached organizations
#

29 min

average attacker breakout time

CrowdStrike, 2026 Global Threat Report

Observed data · CrowdStrike-observed eCrime intrusions · 2026

Method and full statement

The average eCrime breakout time fell to 29 minutes in 2025, with the fastest observed at 27 seconds, according to CrowdStrike's 2026 Global Threat Report.

Method
Threat intelligence and incident telemetry: CrowdStrike Counter Adversary Operations tracking of 280+ adversaries and Falcon platform detections during calendar 2025
Sample
CrowdStrike-observed eCrime intrusions (count not stated)
#

68%

need 15+ minutes to detect a cloud intrusion

CrowdStrike, State of Cloud Detection and Response (CDR) Survey

Survey · 2026

Method and full statement

68% of organizations take 15 minutes or more to detect a cloud intrusion and over half need at least an hour, according to CrowdStrike's 2026 State of CDR survey.

Method
Survey; method not stated
Sample
not stated
#

14 days

global median attacker dwell time

Google Cloud (Mandiant), M-Trends 2026

Observed data · Mandiant investigations · 2026

Method and full statement

The global median dwell time rose to 14 days in 2025 from 11 days in 2024, according to Mandiant's M-Trends 2026.

Method
Incident response data: Mandiant Consulting investigations of targeted attack activity between Jan 1 and Dec 31, 2025 (500k+ investigation hours)
Sample
Mandiant investigations (count not stated)
#

22 sec

from initial access to hand-off between attackers

Google Cloud (Mandiant), M-Trends 2026

Observed data · Mandiant investigations · 2026

Method and full statement

The median time between initial access and hand-off to a second threat group collapsed from more than 8 hours in 2022 to 22 seconds in 2025, according to Mandiant's M-Trends 2026.

Method
Incident response data: Mandiant Consulting investigations of targeted attack activity between Jan 1 and Dec 31, 2025 (500k+ investigation hours)
Sample
Mandiant investigations (count not stated)
#

52%

of intrusions were detected internally

Google Cloud (Mandiant), M-Trends 2026

Observed data · Mandiant investigations · 2026

Method and full statement

Organizations detected 52% of intrusions themselves in 2025, up from 43% in 2024, while 14% were disclosed by the attackers, according to Mandiant's M-Trends 2026.

Method
Incident response data: Mandiant Consulting investigations of targeted attack activity between Jan 1 and Dec 31, 2025 (500k+ investigation hours)
Sample
Mandiant investigations (count not stated)
#

$4.44M

global average cost of a data breach (2025)

IBM, Cost of a Data Breach Report 2025

Survey · 600 breached organizations · 2025

Method and full statement

The global average cost of a data breach was $4.44 million in IBM's 2025 Cost of a Data Breach Report, the first decline in five years.

Method
Survey/interviews by Ponemon Institute (sponsored and analyzed by IBM) of 600 organizations that suffered a data breach, March 2024 to February 2025
Sample
600 breached organizations
#
Show all 12 stats in this section

$10.22M

average U.S. breach cost (2025)

IBM, Cost of a Data Breach Report 2025

Survey · 600 breached organizations · 2025

Method and full statement

The average cost of a data breach in the U.S. hit a record $10.22 million in IBM's 2025 Cost of a Data Breach Report.

Method
Survey/interviews by Ponemon Institute (sponsored and analyzed by IBM) of 600 organizations that suffered a data breach, March 2024 to February 2025
Sample
600 breached organizations
#

241 days

average time to identify and contain a breach

IBM, Cost of a Data Breach Report 2025

Survey · 600 breached organizations · 2025

Method and full statement

It took organizations an average of 241 days to identify and contain a breach, according to IBM's 2025 Cost of a Data Breach Report.

Method
Survey/interviews by Ponemon Institute (sponsored and analyzed by IBM) of 600 organizations that suffered a data breach, March 2024 to February 2025
Sample
600 breached organizations
#

9 min

from initial access to SaaS data exfiltration

Obsidian Security, 2025 SaaS Security Threat Report

Observed data · 2025

Method and full statement

In the fastest SaaS breach Obsidian Security observed, attackers went from initial access to data exfiltration in 9 minutes.

Method
Obsidian incident and telemetry data
Sample
not stated
#

165

organizations exposed in the Snowflake credential campaign

Google Cloud (Mandiant), UNC5537 Targets Snowflake Customer Instances for Data Theft and Extortion

Observed data · ~165 notified organizations · 2024

Method and full statement

Mandiant and Snowflake notified about 165 organizations potentially exposed in the 2024 UNC5537 campaign that used stolen credentials against Snowflake customer accounts without MFA.

Method
Incident response investigation by Mandiant with Snowflake
Sample
~165 notified organizations
#

IT teams · 64 stats

IT teams and SaaS management statistics

IT teams run bigger, faster-moving stacks with fewer people per employee.

IT is stretched thin 38 stats

1:108

IT staff to employee ratio

BetterCloud, 2025 State of SaaS

Survey · n≈600 · 2025

Method and full statement

There is now one IT person for every 108 employees, according to BetterCloud's 2025 State of SaaS report.

Method
Survey of about 600 IT professionals
Sample
n≈600
#

62%

of IT leaders say manual work blocks strategic projects

BetterCloud, 2026 State of SaaS Report

Survey · n=525 · 2026

Method and full statement

62% of IT leaders say manual work is actively preventing them from doing strategic projects, according to BetterCloud's 2026 State of SaaS report.

Method
Survey of IT and security professionals at SaaS-first organizations
Sample
n=525
#

34%

still track IT assets in spreadsheets

Ivanti, 2025 Digital Employee Experience Report

Survey · 3,300+ IT professionals and end users · 2025

Method and full statement

34% of organizations still rely on spreadsheets to track IT assets, according to Ivanti's 2025 Digital Employee Experience report.

Method
Survey of IT professionals and end users worldwide (Ravn Research)
Sample
3,300+ IT professionals and end users
#

60%

of IT professionals feel burnt out

Auvik, 2025 IT Trends Report

Survey · 2025

Method and full statement

60% of IT professionals say they feel burnt out by their work, according to Auvik's 2025 IT Trends Report.

Method
Survey of internal IT and MSP professionals
Sample
not stated
#

58%

spend half their week or more on end-user tickets

Auvik, 2025 IT Trends Report

Survey · 2025

Method and full statement

58% of IT professionals spend half or more of their work week on tickets resolving end-user requests, according to Auvik's 2025 IT Trends Report.

Method
Survey of internal IT and MSP professionals
Sample
not stated
#

36%

of IT time spent building custom integrations

MuleSoft (Salesforce), 2026 Connectivity Benchmark Report

Survey · n=1,050 IT leaders · 2026

Method and full statement

IT teams spend an average of 36% of their time designing, building and testing custom integrations between systems, according to MuleSoft.

Method
Survey of 1,050 IT leaders globally (MuleSoft 2026 Connectivity Benchmark Report)
Sample
n=1,050 IT leaders
#

90%

of organizations lack cross-app automation orchestration

BetterCloud, 2026 State of SaaS Report

Survey · n=525 · 2026

Method and full statement

90% of organizations still lack true cross-app orchestration, according to BetterCloud's 2026 State of SaaS report.

Method
Survey of IT and security professionals
Sample
n=525
#
Show all 38 stats in this section

29%

of IT leaders' top priority is automating IT and SaaS ops

BetterCloud, 2026 State of SaaS Report

Survey · n=525 · 2026

Method and full statement

29% of IT leaders name automating more IT and SaaS operations as their top priority for the next 12 to 18 months, ahead of SaaS security (19%), according to BetterCloud.

Method
Survey of IT and security professionals
Sample
n=525
#

1.6

IT and security staff per 100 employees (median)

Fixify, 2026 IT Help Desk Benchmark Report

Observed data · subset of 30+ organizations with headcount data · 2026

Method and full statement

The median company has 1.6 IT and security staff per 100 employees, with a practical range of 0.7 to 4.3, according to Fixify's 2026 IT Help Desk Benchmark Report.

Method
Customer headcount data alongside ticket telemetry
Sample
subset of 30+ organizations with headcount data
#

1 in 5

help desk tickets stop someone from working

Fixify, 2026 IT Help Desk Benchmark Report

Observed data · 50,000+ tickets across 30+ organizations · 2026

Method and full statement

More than 1 in 5 IT help desk tickets is a work stoppage where the employee cannot work, according to Fixify's 2026 benchmark.

Method
Telemetry: analysis of anonymized help desk tickets
Sample
50,000+ tickets across 30+ organizations
#

3.3%

of IT orgs have fully autonomous AI in service management

SysAid, State of Service Management 2026

Survey · n=718 · 2026

Method and full statement

61% of IT organizations now use AI in service management, but only 3.3% have reached fully autonomous execution, according to SysAid's 2026 research.

Method
Survey of IT professionals
Sample
n=718
#

33%

of AI self-service adopters don't measure ticket reduction

SysAid, State of Service Management 2026

Survey · n=718 · 2026

Method and full statement

33% of organizations using AI-powered self-service in IT are not measuring ticket reduction, according to SysAid's 2026 research.

Method
Survey of IT professionals
Sample
n=718
#

69%

of IT leaders expect budget increases in 2026

Foundry (CIO.com), 2026 State of the CIO Study

Survey · 662 IT leaders + 249 LOB respondents · 2026

Method and full statement

69% of IT leaders expect their IT budgets to increase in 2026, with an average expected rise of 6.93%, according to Foundry's 2026 State of the CIO study.

Method
Online survey of heads of IT plus line-of-business respondents; 36% North America, 20% EMEA, 42% APAC
Sample
662 IT leaders + 249 LOB respondents
#

34%

of IT leaders held back by staff and skills shortages

Foundry (CIO.com), 2026 State of the CIO Study

Survey · 662 IT leaders + 249 LOB · 2026

Method and full statement

Staffing and skills shortages are a distraction for 34% of IT leaders, according to Foundry's 2026 State of the CIO study.

Method
Online survey of heads of IT
Sample
662 IT leaders + 249 LOB
#

56%

of organizations expanding business process and IT automation

Foundry (CIO.com), 2026 State of the CIO Study

Survey · 662 IT leaders + 249 LOB · 2026

Method and full statement

56% of organizations are expanding business process and IT automation initiatives in 2026, according to Foundry's State of the CIO study.

Method
Online survey of heads of IT
Sample
662 IT leaders + 249 LOB
#

1.6

roles the average CIO holds

Foundry (CIO.com), 2026 State of the CIO Study

Survey · 662 IT leaders + 249 LOB · 2026

Method and full statement

Three quarters of CIOs say it is difficult to balance business innovation with operational excellence, and the average CIO juggles 1.6 roles, according to Foundry.

Method
Online survey of heads of IT
Sample
662 IT leaders + 249 LOB
#

78%

plan to add or replace an IT automation platform

Stonebranch, 2026 Global State of IT Automation Report

Survey · 400+ · 2026

Method and full statement

78% of organizations plan to add (56%) or replace (22%) an IT automation platform in the near term, according to Stonebranch's 2026 Global State of IT Automation report.

Method
Quantitative survey of enterprise IT Ops, DevOps, CloudOps, DataOps and PlatformOps professionals
Sample
400+
#

46%

say new software deployments drive up ticket volume

Ivanti, 2025 Technology at Work Report

Survey · 1,200 IT and cybersecurity professionals · 2025

Method and full statement

46% of IT professionals say new software deployments drive up help desk ticket volume, according to Ivanti's 2025 Technology at Work report.

Method
Survey (Ravn Research)
Sample
1,200 IT and cybersecurity professionals
#

38%

say tech complexity is a significant barrier to IT operations

Ivanti, 2025 Technology at Work Report

Survey · 1,200 IT and cybersecurity professionals · 2025

Method and full statement

38% of IT professionals say tech complexity has become a significant barrier to effective IT operations, up four points in a year, according to Ivanti.

Method
Survey (Ravn Research)
Sample
1,200 IT and cybersecurity professionals
#

37%

say complexity stops them upholding basic security

Ivanti, 2025 Technology at Work Report

Survey · 1,200 IT and cybersecurity professionals · 2025

Method and full statement

37% of IT professionals say their tech infrastructure is so complex they cannot uphold basic security practices, according to Ivanti.

Method
Survey (Ravn Research)
Sample
1,200 IT and cybersecurity professionals
#

2 in 3

IT pros say daily operations crowd out employee experience

Ivanti, 2025 Digital Employee Experience Report

Survey · 3,300+ IT professionals and end users · 2025

Method and full statement

Nearly 2 in 3 IT professionals say day-to-day IT operations are so overwhelming that employee experience takes a back seat, according to Ivanti.

Method
Survey (Ravn Research)
Sample
3,300+ IT professionals and end users
#

44%

say workload outweighs their ability to be productive

Auvik, 2025 IT Trends Report

Survey · 2025

Method and full statement

44% of IT professionals say the burden of work is outweighing their ability to be productive, according to Auvik's 2025 IT Trends Report.

Method
Survey of internal IT and MSP professionals
Sample
not stated
#

47%

of SME IT admins say too many point solutions is their top challenge

JumpCloud, Q1 2025 SME IT Trends Report

Survey · n=900 · 2025

Method and full statement

26% of SME IT admins juggle 11 or more IT tools, and 47% rank managing too many point solutions as their top challenge, according to JumpCloud.

Method
Survey by Propeller Insights
Sample
n=900
#

74%

of IT leaders say their environment is too complex

JumpCloud, Q3 2025 IT Trends Report

Survey · 800+ IT leaders · 2025

Method and full statement

74% of IT leaders say their IT environment is too complex, and organizations rely on more than nine platforms to run IT, according to JumpCloud's Q3 2025 IT Trends Report.

Method
Survey of IT leaders
Sample
800+ IT leaders
#

19%

of organizations have fully unified their IT stack

JumpCloud, Q3 2025 IT Trends Report

Survey · 800+ IT leaders · 2025

Method and full statement

Only 19% of organizations have fully unified their IT stack, according to JumpCloud's Q3 2025 IT Trends Report.

Method
Survey of IT leaders
Sample
800+ IT leaders
#

55%

of companies plan to raise IT budgets in 2026 (down from 62%)

Spiceworks (Ziff Davis / Aberdeen), 2026 State of IT

Survey · 2025

Method and full statement

55% of companies plan to increase IT budgets in 2026, down from 62% in 2025, according to Spiceworks' 2026 State of IT report.

Method
Survey of IT decision-makers; method not stated on page
Sample
not stated
#

33%

of IT budgets still go to keeping the lights on

IBM Institute for Business Value, Intelligent IT automation

Survey · 680 companies · 2025

Method and full statement

33% of IT budgets are still devoted to maintaining existing systems, according to IBM Institute for Business Value research.

Method
Benchmarking data from IT leaders
Sample
680 companies
#

90 vs 140

IT staff per $1B revenue, automated vs not

IBM Institute for Business Value, Intelligent IT automation

Survey · 680 companies · 2025

Method and full statement

Highly automated organizations employ only 90 IT staff per $1 billion in revenue, versus 140 for less automated peers, according to IBM Institute for Business Value.

Method
Benchmarking data from IT leaders
Sample
680 companies
#

78%

of IT teams handle password issues every week

Dashlane, Shadow IT and IT burnout survey

Survey · 1,000 U.S. employees + 500 U.S. IT leaders · 2025

Method and full statement

78% of IT leaders say their teams deal with employee password issues at least weekly, and 28% daily or more, according to Dashlane research.

Method
Survey of U.S. employed adults and U.S. IT leaders
Sample
1,000 U.S. employees + 500 U.S. IT leaders
#

73%

of European IT pros have experienced stress or burnout

ISACA, Tech Workplace and Culture survey (Europe findings)

Survey · 2025

Method and full statement

73% of European IT professionals have experienced work-related stress or burnout, and 61% blame heavy workloads, according to ISACA.

Method
Survey of IT professionals in Europe; sample not stated in release
Sample
not stated
#

31%

IT cost reduction attributed to intelligent automation

IBM Institute for Business Value, Intelligent IT automation

Survey · 680 companies · 2025

Method and full statement

Organizations attribute a 31% reduction in IT costs to intelligent automation, according to IBM Institute for Business Value benchmarking.

Method
Benchmarking data from IT leaders
Sample
680 companies
#

23%

of IT pros saw a colleague quit from burnout

Ivanti, 2024 Everywhere Work Report

Survey · 7,700+ respondents · 2024

Method and full statement

Nearly one in four IT professionals (23%) say a colleague has resigned due to burnout, according to Ivanti's 2024 Everywhere Work report.

Method
Survey of executive leaders, IT and cybersecurity professionals and office workers (Ravn Research)
Sample
7,700+ respondents (all groups)
#

76%

say AI and automation can cut ticket volume

Ivanti, 2024 Everywhere Work Report

Survey · 7,700+ respondents · 2024

Method and full statement

76% of IT professionals say AI and automation can help decrease ticket volume and provide better service, according to Ivanti's 2024 Everywhere Work report.

Method
Survey (Ravn Research)
Sample
7,700+ respondents (all groups)
#

29%

of network and SaaS tasks still done manually

Auvik, IT Trends 2024: Industry Report

Survey · n=2,100 · 2024

Method and full statement

On average, 29% of network and SaaS-related tasks are still done mostly or completely manually, according to Auvik's 2024 IT Trends Report.

Method
Survey of internal IT and MSP professionals
Sample
n=2,100
#

84%

of IT leaders saw burnout in their direct reports

Gartner Peer Community, One-Minute Insights: Managing Burnout in IT

Survey · n=268 IT leaders · 2023

Method and full statement

In a Gartner Peer Community poll, 84% of IT leaders said at least one of their direct reports showed signs of burnout in the past year, and 68% blamed work overload.

Method
Gartner Peer Community One-Minute Insights poll of IT leaders
Sample
n=268 IT leaders
#

60%

of IT leaders felt burnout in the past year

Gartner Peer Community, One-Minute Insights: Managing Burnout in IT

Survey · n=268 IT leaders · 2023

Method and full statement

In a Gartner Peer Community poll, 60% of IT leaders said they had personally felt burnout in their role in the past 12 months, with 67% citing an unmanageable workload.

Method
Gartner Peer Community One-Minute Insights poll of IT leaders
Sample
n=268 IT leaders
#

8%

of organizations prioritized automating repetitive IT tasks (2023)

Ivanti, Defending IT Talent Report (Everywhere Work series)

Survey · n=1,800 · 2023

Method and full statement

A quarter of IT professionals were seriously considering leaving their jobs within six months, and only 8% of organizations prioritized automation for repetitive tasks, according to Ivanti's 2023 Defending IT Talent report.

Method
Survey of IT professionals and C-level executives globally
Sample
n=1,800
#

Visibility is the first gap 9 stats

36%

have complete IT asset visibility

Flexera, 2026 State of ITAM Report

Survey · n=512 · 2026

Method and full statement

Only 36% of organizations have complete visibility into their IT estate, down from 43% in 2025, according to Flexera's 2026 State of ITAM report.

Method
Survey of 512 technology / ITAM professionals worldwide
Sample
n=512
#

70%

of tech execs say the business deploys tech faster than IT can track

IBM Institute for Business Value, CIO/CTO AI control gap study (with Oxford Economics)

Survey · n=2,000 · 2026

Method and full statement

70% of CIOs and CTOs say teams across the business are deploying technology faster than IT can track, according to a 2026 IBM Institute for Business Value study.

Method
Survey of senior executives responsible for IT, technology or AI decisions across 33 geographies and 19 industries
Sample
n=2,000
#

$3B+

in shadow software spend identified

Tropic, The State of Software Procurement in 2026

Observed data · Tropic customer portfolios · 2026

Method and full statement

Tropic has found more than $3 billion in 'shadow spend' across customer software portfolios, spending that existed before organizations had the visibility to see it.

Method
Transaction data: negotiated outcomes across $23B+ in tracked spend, 100,000+ negotiations, 30,000+ SKUs across 14,000+ suppliers (Tropic customers)
Sample
Tropic customer portfolios
#

66%

have visibility into their SaaS environment

Flexera, 2026 State of ITAM Report

Survey · n=512 · 2026

Method and full statement

66% of organizations have visibility into their SaaS environment, but only 31% have visibility into AI software, according to Flexera.

Method
Survey of 512 technology / ITAM professionals worldwide
Sample
n=512
#

12%

of SaaS spending is unmanaged

Capgemini Research Institute, On-Demand Tech (FinOps) report

Survey · n=1,000 executives · 2025

Method and full statement

12% of all SaaS spending at large organizations is unmanaged, according to Capgemini Research Institute.

Method
Survey of 1,000 executives at organizations with $1B+ annual revenue using cloud, SaaS and GenAI, across 12 sectors and 14 countries; fielded May 2025
Sample
n=1,000 executives
#

43%

have complete visibility across the tech stack (down from 47%)

Flexera, 2025 State of ITAM Report

Survey · n=506 · 2025

Method and full statement

Flexera's 2025 State of ITAM Report found complete visibility across the technology stack fell to 43% from 47% a year earlier.

Method
Survey of global IT professionals
Sample
n=506
#

85%

of IT leaders say visibility gaps are a risk

Flexera, 2026 IT Priorities Report

Survey · n=834 · 2025

Method and full statement

85% of IT leaders say gaps in IT visibility pose a risk to their organization, according to Flexera's 2026 IT Priorities Report.

Method
Survey of global IT decision-makers
Sample
n=834
#

29%

lack visibility into SaaS spend

BetterCloud, State of SaaSOps 2024

Survey · 2024

Method and full statement

29% of companies say they lack sufficient visibility into their SaaS spend, according to BetterCloud's State of SaaSOps 2024.

Method
Annual survey of IT professionals (sample size not stated in release)
Sample
not stated
#
Show all 9 stats in this section

47%

of software vendors can see if customers use it

Revenera, Monetization Monitor 2025 Outlook

Survey · n=418 · 2024

Method and full statement

Only 47% of software producers can see whether a customer is using their software at all, according to Revenera's Monetization Monitor 2025 Outlook.

Method
Survey of leaders at global technology companies
Sample
n=418
#

SaaS management grows up 17 stats

70%

of organizations will use SMPs by 2028

Gartner (via USU), 2025 Gartner Magic Quadrant for SaaS Management Platforms

Forecast · 2025

Method and full statement

Gartner predicts that by 2028 over 70% of organizations will centralize SaaS management using SaaS management platforms, up from less than 30% in 2025.

Method
Analyst forecast (strategic planning assumption)
Sample
not applicable
#

<10%

of organizations centralized SaaS management on an SMP in 2024

Gartner (quoted by Josys), Magic Quadrant for SaaS Management Platforms 2024

Forecast · 2024

Method and full statement

Gartner's 2024 (inaugural) Magic Quadrant for SaaS Management Platforms predicted that through 2027, over 50% of organizations will centralize SaaS management using an SMP, up from less than 10% in 2024.

Method
Analyst forecast (Strategic Planning Assumption)
Sample
not applicable
#

64%

of ITAM teams manage SaaS licenses

Flexera, 2026 State of ITAM Report

Survey · n=512 · 2026

Method and full statement

Only 64% of IT asset management teams manage SaaS licenses, compared with 75% that manage cloud software licenses, according to Flexera.

Method
Survey of 512 technology / ITAM professionals worldwide
Sample
n=512
#

32%

of ITAM team time goes to software optimization

Flexera, 2026 State of ITAM Report

Survey · n=512 · 2026

Method and full statement

IT asset management teams spend the largest share of their time (32%) on software optimization, followed by audit response (22%), according to Flexera's 2026 State of ITAM Report.

Method
Survey of technology professionals worldwide
Sample
n=512
#

47%

name security and governance their top SaaS management challenge

BetterCloud, 2026 State of SaaS Report

Survey · n=525 · 2026

Method and full statement

Security and governance became IT's biggest SaaS management challenge for 47% of IT leaders in 2026, up from 28% a year earlier, according to BetterCloud.

Method
Survey of IT and security professionals
Sample
n=525
#

86%

of IT leaders call SMPs crucial to AI governance

BetterCloud, 2026 State of SaaS Report

Survey · n=525 · 2026

Method and full statement

86% of IT leaders say SaaS management platforms are crucial to good AI governance, according to BetterCloud's 2026 State of SaaS report.

Method
Survey of IT and security professionals
Sample
n=525
#

90%

of FinOps teams now manage or plan to manage SaaS

FinOps Foundation, State of FinOps 2026 (6th annual)

Survey · ~700 respondents · 2026

Method and full statement

90% of FinOps practitioners now manage SaaS spend or plan to within a year, up from 65% in 2025, according to the FinOps Foundation's State of FinOps 2026.

Method
Annual survey of FinOps practitioners
Sample
~700 respondents (N=695 for this question)
#

5x

more susceptible to a cyber incident without central SaaS management

Gartner (quoted by BetterCloud), Magic Quadrant for SaaS Management Platforms 2025

Forecast · 2025

Method and full statement

Gartner warns that through 2027, organizations that fail to centrally manage SaaS life cycles will remain five times more susceptible to a cyber incident or data loss.

Method
Analyst forecast (Strategic Planning Assumption)
Sample
not applicable
#
Show all 17 stats in this section

52%

of CIOs under pressure to reduce costs

Gartner, The CIO Agenda 2026 / 2026 CIO and Technology Executive Survey

Survey · 2025

Method and full statement

According to Gartner's 2026 CIO and Technology Executive Survey, 57% of CIOs face pressure to improve productivity and 52% face pressure to reduce costs.

Method
Survey of CIOs and technology executives
Sample
n=2,501 CIOs and technology executives, all regions
#

38%

of ITAM teams collaborate with FinOps

Flexera, 2025 State of ITAM Report

Survey · n=506 · 2025

Method and full statement

ITAM teams increasingly work with FinOps: 38% collaborate with FinOps teams and 44% with cloud teams, according to Flexera's 2025 State of ITAM Report.

Method
Survey of global IT professionals
Sample
n=506
#

70%

of IT teams prefer a unified SaaS management platform

BetterCloud, State of SaaS 2025

Survey · nearly 600 · 2025

Method and full statement

70% of IT teams prefer a unified SaaS management platform, and 51% find point solutions harder to manage SaaS with, according to BetterCloud's 2025 State of SaaS report.

Method
Survey of IT professionals
Sample
nearly 600
#

88%

of IT decision-makers open to switching tech vendors

Spiceworks (Ziff Davis / Aberdeen), 2026 State of IT

Survey · 2025

Method and full statement

88% of IT decision-makers are open to switching at least some tech vendors, and re-evaluating vendors or contracts (39%) is their top cost-saving measure, according to Spiceworks' 2026 State of IT.

Method
Survey of IT decision-makers; method not stated on page
Sample
not stated
#

52%

report more scrutiny on SaaS purchasing

BetterCloud, State of SaaSOps 2024

Survey · 2024

Method and full statement

52% of IT professionals say SaaS purchases now face more scrutiny than before, according to BetterCloud.

Method
Annual survey of IT professionals (sample size not stated in release)
Sample
not stated
#

48%

invest most heavily in SaaS monitoring and management

Auvik, IT Trends 2024: Industry Report

Survey · n=2,100 · 2024

Method and full statement

48% of IT teams say they are investing most heavily in SaaS monitoring and management tools, according to Auvik's 2024 IT Trends Report.

Method
Survey of internal IT and MSP professionals
Sample
n=2,100
#

55%

of finance leaders blame tech leaders for lack of transparency

Vertice, Finance vs tech leaders cloud spending survey

Survey · n=600 · 2023

Method and full statement

71% of finance leaders list SaaS fees among their top three cost-saving priorities, and 55% blame a lack of transparency from tech leaders, according to a Vertice survey.

Method
Survey of senior finance and tech leaders in the US and UK
Sample
n=600
#

40%

of multi-SaaS organizations to centralize on an SMP by 2027 (2022 forecast)

Gartner (quoted by BetterCloud), Market Guide for SaaS Management Platforms (Dan Wilson, Jaswant Kalay, Tom Cipolla, Joe Mariano), ID G00745874

Forecast · 2022

Method and full statement

In its 2022 Market Guide for SaaS Management Platforms, Gartner predicted that by 2027, 40% of organizations using multiple SaaS applications would centralize management using an SMP, up from less than 25% in 2022.

Method
Analyst forecast
Sample
not applicable
#

How this page was built

Torii data is observed

Figures marked Torii data come from the Torii SaaS Benchmark Annual Report 2026: aggregated, anonymized discovery data covering the apps, licenses and spend that actually appear in the environments Torii connects to. The 2026 report covers January to December 2025. It does not publish a sample size, and some charts state no measurement window of their own. Where that is the case, the figure says so.

Every other number links to its origin

Each third-party statistic links to the page or PDF where the organization that ran the research published it. We excluded roundups and aggregator sites, re-fetched every source to confirm the number is there, and labeled each one as observed data, a survey or a forecast. Vendor research carries the vendor's name, since most of it comes from companies that sell into the problem they measured.

Numbers disagree, and that is information

Apps per company ranges from 101 to 957 depending on what is counted. Waste estimates range from 20% to 65%. Read the method line on any card before comparing two figures. A few CyberArk links point to archived copies because the original pages now redirect after its acquisition.

Download the data

Every statistic on this page, with its source link, method and sample, in one file.

Download all 694 statistics (CSV)

How to cite

Use Copy citation on any card, or link straight to a statistic with its # link. For Torii figures: Torii, SaaS Benchmark Annual Report 2026, toriihq.com/articles/saas-statistics.

Go deeper

Get the data behind the numbers

Read Torii's full benchmark, and see why Gartner named Torii a Leader in SaaS management platforms.

Frequently asked questions

How many SaaS apps does the average company use?

It depends on what is counted. Torii's discovery data finds 831 apps in the average organization (median 682), shadow IT included. Okta counts 101 apps connected to its single sign-on, and BetterCloud's survey of IT teams puts it at 106.

What percentage of apps are shadow IT?

In Torii's 2026 SaaS Benchmark, 61.3% of apps in the average portfolio are shadow IT, discovered through usage, browser activity or direct sign-up rather than procurement. Only 15.5% are formally approved.

How common is shadow AI?

Very. 26 of the top 50 shadow IT apps in Torii's 2025 data were pure-play AI tools, and Torii discovered 694 new AI-native apps in 2025. In Microsoft and LinkedIn's 2024 survey, 78% of AI users said they bring their own AI tools to work.

How much SaaS spend is wasted?

Estimates vary by method. Vertice's platform data puts 65% of SaaS licenses as unused or underutilized, while Flexera's survey respondents estimate 20% to 32% of SaaS spend is wasted. Torii finds Salesforce licenses have a 55% non-utilization rate.

How many machine identities are there per employee?

CyberArk's 2025 survey reports 82 machine identities for every human. Entro's observed data puts the ratio at 144 to 1.

Which SaaS management platforms does Gartner rate as Leaders?

Torii is named a Leader in the 2026 Gartner Magic Quadrant for SaaS Management Platforms, which evaluated 16 vendors. Torii has been a Leader in every edition since the first Magic Quadrant for the category in 2024. The report is available from Torii.

Where do these statistics come from?

Torii's own figures come from the 2026 SaaS Benchmark Annual Report, based on aggregated, anonymized discovery data. Every other figure links to the organization that published the research. The page holds 694 statistics from 106 publishers.