4 Ways to Monitor User Activity in Okta in 2026

Keeping track of who signs in, what apps they access, and when changes happen in Okta can feel overwhelming for admins. You need reliable visibility to spot misuse, meet audit requirements, and speed up response.
This article walks through four practical ways to monitor user activity in Okta so you can build clearer logs, stronger audits, and faster incident response. No fluff, actionable steps you can apply today.
Table of Contents
Use Okta’s UI
Here, you’ll use the Okta Admin Console to view, filter, save, and export user activity from the System Log and built-in Reports, following Okta’s UI guidance.
Open the Admin Console and go to logs
- Sign in to your Okta Admin Console.
- From the top navigation pick
Reportsthen chooseSystem Log. - If your org uses a custom domain, sign in to that admin URL first.
Use basic filters to find the events you care about
- Start with the time range selector to narrow the period.
- Click
Add Filterand try these common filters:- Event category: choose things like Authentication, MFA, or User Lifecycle.
- Actor or Target: enter a user’s email or name to see events they caused or were affected by.
- App: pick a specific application to see sign-ons and provisioning events for that app.
- Outcome or Status: filter for Success or Failure to spot failed logins.
- You can combine filters to narrow results (for example, failed authentication + specific user).
Read event details
- Click any row to open the event detail pane.
- Look for these fields:
- Timestamp
- Event type and description
- Actor (who performed the action)
- Target (which user or app was affected)
- Client IP and device info
- Copy the raw event details from the pane if you need to paste it into a ticket or review it later.
Save searches and reuse them
- After you build a useful filter set, click
Save searchand give it a clear name. - Open saved searches later from the Saved Searches menu to run them again quickly.
- Keep a few standard saved searches, like “failed logins last 7 days” or “profile changes”.
Turn saved searches into alerts (if enabled)
- If your Okta plan and settings include Alerts, you can convert a saved search into an alert rule so admins get notified when matching events occur.
- If you don’t see an Alerts option, check with your Okta administrator-some features require specific permissions or plan levels.
Use built-in Reports for trends and quick checks
- In the Admin Console go to
Reports>Reports. - Pick a report such as authentication or user activity to see charts and summaries.
- Adjust the date range and any available filters.
- Use these reports to spot trends like rising failed logins or spikes in new device enrollments.
Export or schedule data for off-console review
- From System Log or many Report views you can export results as CSV (look for an Export or Download button).
- For larger exports Okta may prepare a file and notify you when it’s ready.
- Some reports can be scheduled to run and send results automatically, depending on your Okta plan.
Practical checks to monitor regularly
- Watch failed authentication trends and the IPs tied to them.
- Track MFA enrollments and changes to authentication policies.
- Review app assignments and provisioning events after onboarding or role changes.
- Save common searches and review them on a schedule (daily or weekly).
These steps follow Okta’s Admin Console UI guidance for the System Log and Reports. Use saved searches and exports to make regular monitoring repeatable and easier for your team.
Use Torii
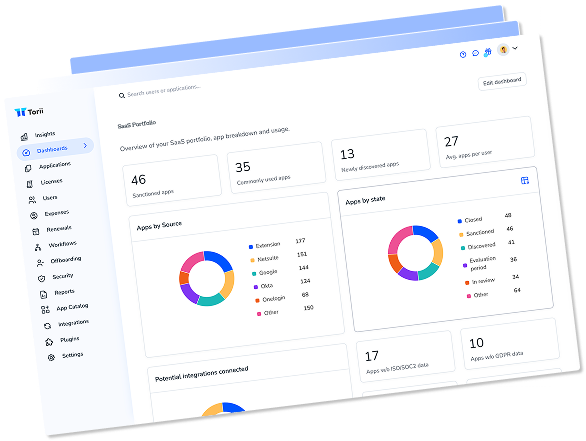
Rather than integrating with Okta directly, you can use Torii, a SaaS Management Platform, to track user activity in Okta. SMPs combine your SaaS subscriptions into a single dashboard, giving you one place to see all your SaaS applications and related data.
To view Okta user activity from Torii, complete these steps:
1. Sign up for Torii
Contact Torii to request a complimentary two-week proof-of-concept.
2. Connect your Okta account to Torii
After your Torii instance is active, add your Okta account (assuming you already have one). Here are the instructions for the Okta integration.
3. Search for Okta within Torii
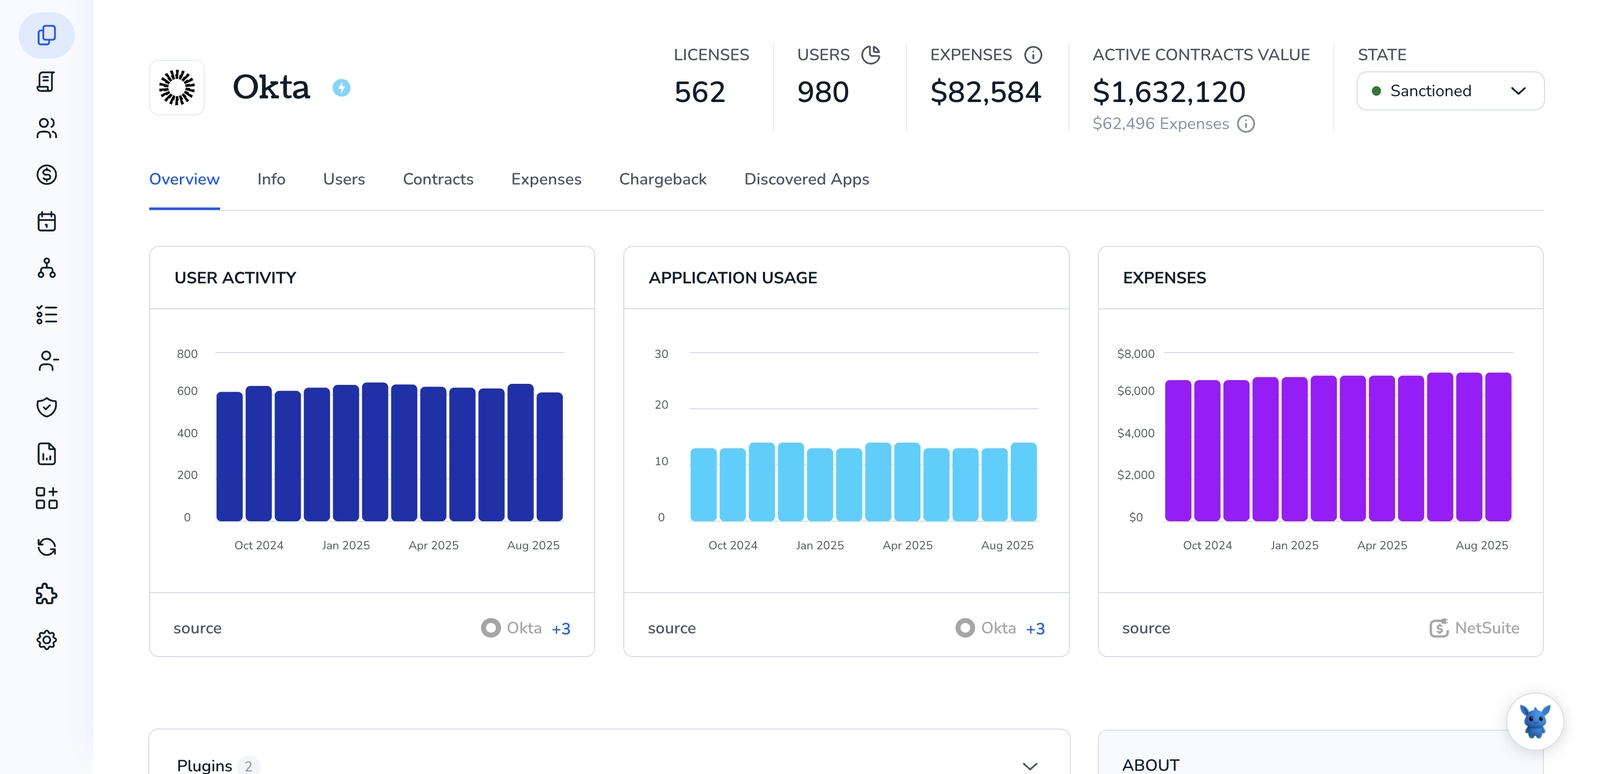
Use the search box at the top of the Torii dashboard to find Okta. That page presents an Okta overview with details like license counts, expenditure, next renewal date, and other account metrics.

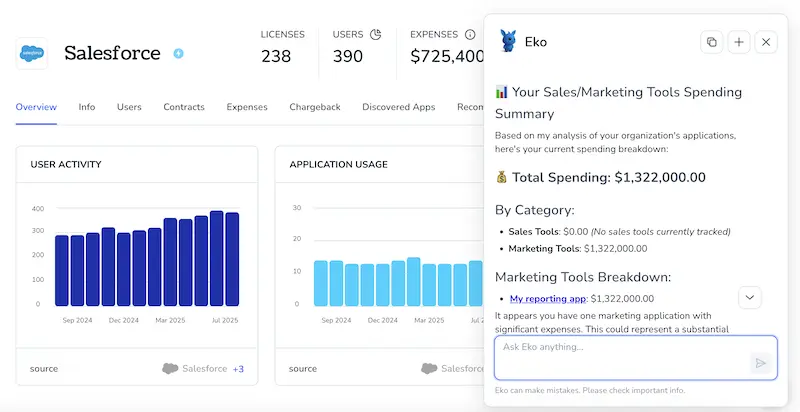
Or, chat with Eko
Torii’s AI helper, Eko, can also retrieve Okta details inside Torii using natural, conversational queries. Click the Eko icon in the bottom-right corner of the dashboard and ask it to find Okta’s information - it will show the results directly in the chat window.
Use Okta’s API
Use Okta’s API to monitor user activity
Here you’ll use Okta’s System Log API to pull events about users, filter for specific activity, and page through results. The examples use the REST API only-no UI steps.
Get an API credential for calls
You need an Okta API token or an OAuth access token to call the System Log API. Put it in the Authorization header as either:
Authorization: SSWS ${OKTA_API_TOKEN}Authorization: Bearer ${ACCESS_TOKEN}
Example curl to test a token:
curl -i -H "Accept: application/json" -H "Authorization: SSWS ${OKTA_API_TOKEN}" "https://{youroktadomain}/api/v1/logs?limit=1"
Read the System Log
The System Log endpoint returns events. Start with a simple fetch and increase filters once you see the data.
Example curl to fetch recent logs:
curl -s -H "Accept: application/json" -H "Authorization: SSWS ${OKTA_API_TOKEN}" "https://{youroktadomain}/api/v1/logs?limit=200"
The response is JSON array of events. Each event has fields like eventType, published, actor, target, and outcome.
Filter results to a specific user
You can filter by user ID, email, or other fields using the filter query parameter.
Example: filter by user ID
curl -s -H "Accept: application/json" -H "Authorization: SSWS ${OKTA_API_TOKEN}" "https://{youroktadomain}/api/v1/logs?filter=target.id%20eq%20%2200u1abcdEXAMPLE%22&limit=200"
Example: filter by user email (actor alternateId)
curl -s -H "Accept: application/json" -H "Authorization: SSWS ${OKTA_API_TOKEN}" "https://{youroktadomain}/api/v1/logs?filter=actor.alternateId%20eq%20%[email protected]%22&limit=200"
Narrow by event type or combine filters
Use eventType and logical operators in filter to find specific actions.
Examples:
Single event type:
curl -s -H "Accept: application/json" -H "Authorization: SSWS ${OKTA_API_TOKEN}" "https://{youroktadomain}/api/v1/logs?filter=eventType%20eq%20%22user.session.start%22&limit=200"
Combined: user email and event type
curl -s -H "Accept: application/json" -H "Authorization: SSWS ${OKTA_API_TOKEN}" "https://{youroktadomain}/api/v1/logs?filter=actor.alternateId%20eq%20%[email protected]%22%20and%20eventType%20eq%20%22user.session.start%22&limit=200"
Use time ranges and handle pagination
Add since and until to limit the time window. Use after to page through results. The API may return a Link header with a rel="next" and an after cursor.
Example: fetch a time window
curl -s -H "Accept: application/json" -H "Authorization: SSWS ${OKTA_API_TOKEN}" "https://{youroktadomain}/api/v1/logs?since=2025-08-01T00:00:00Z&until=2025-08-02T00:00:00Z&limit=200"
Example: loop through pages (bash)
AFTER="
while :; do
if [ -z "$AFTER" ]; then
RESP=$(curl -i -s -H "Accept: application/json" -H "Authorization: SSWS ${OKTA_API_TOKEN}" "https://{youroktadomain}/api/v1/logs?limit=200")
else
RESP=$(curl -i -s -H "Accept: application/json" -H "Authorization: SSWS ${OKTA_API_TOKEN}" "https://{youroktadomain}/api/v1/logs?limit=200&after=${AFTER}")
fi
echo "$RESP"  sed -n '/^\r$/,$p'  jq '.' # body
NEXT=$(echo "$RESP"  tr -d '\r'  grep -i '^Link:'  sed -n 's/.*after=\([^&>]*\).*/\1/p' )
if [ -z "$NEXT" ]; then
break
fi
AFTER="$NEXT"
done
The loop reads the Link header to get the after cursor and stops when there’s no next link.
Subscribe or push events (Event Hooks)
If you want events delivered instead of polling, use Okta Event Hooks. Create an event hook via the Event Hooks API and subscribe to event types you care about. The Event Hooks API requires you to register a URL and validate the subscription challenge.
Example JSON payload to create an event hook (send with POST to /api/v1/eventHooks):
{
    "name": "user-activity-hook",
    "events": [
        {
            "type": "com.okta.event_type",
            "format": "JSON"
        }
    ],
    "channel": {
        "type": "HTTP",
        "version": "1.0.0",
        "config": {
            "uri": "https://your-receiver.example.com/hook",
            "headers": []
        }
    }
}
After creation, Okta will send a verification request to the uri; complete that challenge per the API flow.
Validate and map fields you need
Look at event JSON fields to pick what to store or alert on:
eventType- what happenedpublished- timestampactor.alternateIdandactor.id- user who took actiontarget- affected user or objectoutcome- success or failure
There are many event types for logins, MFA, user lifecycle, admin actions, and more. Refer to Okta’s System Log API docs for full field and event type details.
Tips for production use
- Request only the fields you need and filter on the server to reduce volume.
- Respect rate limits and use pagination.
- Keep tokens secure and rotate them per your policy.
- Use Event Hooks when you want near-real-time delivery instead of frequent polling.
This flow follows Okta’s System Log and Event Hooks APIs. Check the API docs for exact parameter behavior, supported eventType values, and any updates to pagination and authentication methods.
Use Claude (via MCP)
You can also retrieve this information directly from Claude using the Model Context Protocol (MCP). Claude is Anthropic’s AI assistant and a competitor to ChatGPT.
To inspect Okta user activity from within Claude, do the following:
1. Set up Torii
Complete the Torii setup described above to link your Okta account with Torii: https://www.toriihq.com/
Then, in Torii’s Settings, generate a new API key.
2. Set up MCP in Claude
See the Torii MCP docs here: https://www.npmjs.com/package/@toriihq/torii-mcp?activeTab=readme and this explanatory blog post: https://www.toriihq.com/blog/introducing-model-context-protocol-in-torii
Install the Claude Desktop app, then add the following to your claude_desktop_config.json file:
{
    "mcpServers": {
        "Torii MCP": {
            "command": "env",
            "args": [
                "TORII_API_KEY=YOUR_API_KEY",
                "npx",
                "@toriihq/torii-mcp"
            ]
        }
    }
}
You can create that API key from the Settings tab in Torii.
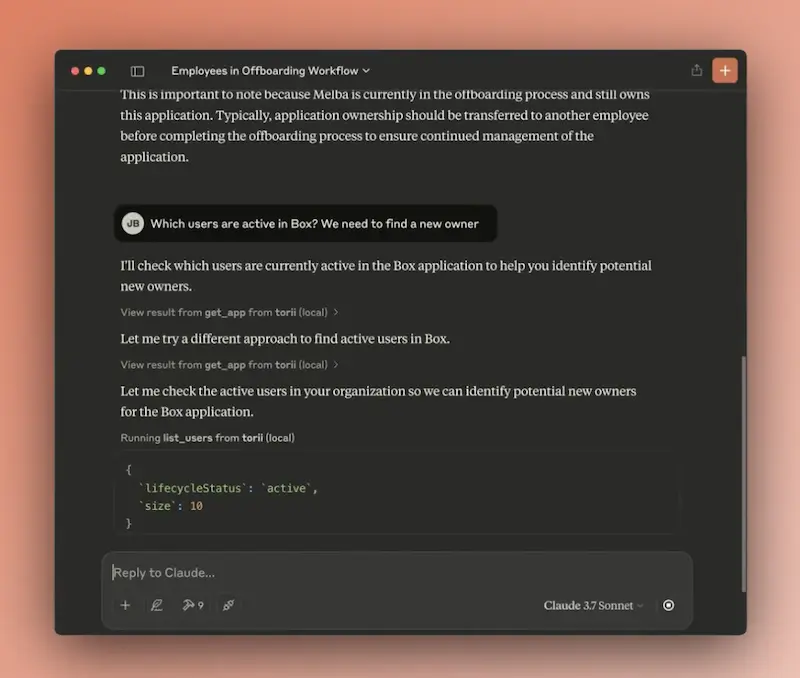
3. Chat with Claude
Once configured, you can query your Torii data directly from Claude - for example, ask it to review your Okta account to report license counts, total spend, upcoming renewal dates, and other metrics.
Frequently Asked Questions
Start in the Okta Admin Console System Log, apply filters, and save searches. Export or schedule reports, integrate Torii for cross-app visibility, pull events with the System Log API, or subscribe to Event Hooks for near real-time feeds.
Use the time range picker, then add filters for event category, actor or target, application, and outcome. Combining, for example, \"Authentication + Failure + specific user\" quickly surfaces risky activity. Save effective filter sets for quick reuse and auditing.
Yes. If Alerts are enabled in your Okta plan, open any saved search and choose the alert option to convert it into a rule. Okta will then notify designated admins whenever future events match that search’s criteria.
Torii connects to your Okta tenant and pulls license counts, spending, renewals, and user-activity data into a single SaaS dashboard. You can search the Okta tile or ask Torii’s Eko chatbot to expose sign-in trends, provisioning events, and other metrics.
Authenticate with an API token or OAuth access token, request only needed fields, filter by user, event type, or time window, and paginate with the \"after\" cursor. Respect rate limits, rotate credentials, and prefer Event Hooks for near real-time delivery.
After linking Okta to Torii and enabling the Torii MCP server in Claude, you can simply ask Claude conversational questions like \"show Okta license spend\" or \"list failed logins.\" Claude pulls the data through MCP and returns immediate, structured answers.