4 Ways to Find Annual Cost in QuickBooks

Finding annual cost in QuickBooks can feel messy when receipts, invoices, and bank activity are scattered. You need clear yearly totals and a reliable way to reconcile with bank statements.
This article shows four practical QuickBooks methods to pull annual cost, calculate yearly expenses, and reconcile totals. I’ll cover reports, date filters, exports, and reconciliation checkpoints so your books match your bank.
Table of Contents
Use QuickBooks’s UI
Here, you’ll use QuickBooks Online’s Reports to pull the total annual cost for your business or by vendor.
Open Reports
- In QuickBooks Online, click Reports in the left menu.
- In the search box, type
Profit and LossorExpenses by Vendor Summaryand pick the report you want.
Get company-wide annual cost with Profit and Loss
- Open the
Profit and Lossreport. - Click Customize.
- Set the report period:
- Choose
Last Yearor pickCustomand enter your fiscal year start and end dates (for example,01/01/2024to12/31/2024).
- Choose
- Adjust columns if you want:
- Under Rows/Columns, set Columns to
Total onlyorYearsto see the full-year total. - Run the report.
- Look for the
Total expensesline (it shows the full annual cost). That number is your company’s annual expense amount.
- Under Rows/Columns, set Columns to
Get annual cost by vendor
- Open the
Expenses by Vendor Summaryreport. - Click Customize.
- Set the report period the same way you did above.
- Optionally filter to specific vendors or expense accounts:
- Use the Filter section to check the vendors or accounts you want included.
- Run the report.
- The report lists each vendor’s total for the year and a grand total at the bottom.
Drill down or verify individual accounts
- From the Profit and Loss report, click any expense amount to open the detail transactions for that account and year.
- Review, export, or print the transaction list if you need a line-by-line check.
Export or save the report
- To share or keep records, click Export and choose
Export to ExcelorExport to PDF. - If you’ll run this every year, click Save customization to reuse the same settings later.
QuickBooks’ reports are the simplest way to see annual costs. If you need totals by account, vendor, or custom date ranges, pick the corresponding report and set the dates the same way above.
Use Torii
Instead of digging through QuickBooks itself, you can use Torii, a SaaS Management Platform, to determine the annual cost associated with QuickBooks. SMPs combine all your SaaS subscriptions in one dashboard, giving you a single source of truth for every tool you use.
To surface the annual cost from QuickBooks inside Torii, do the following:
1. Sign up for Torii
Contact Torii and request a complimentary two-week proof-of-concept.
2. Connect your expense accounts & contracts to Torii
After your Torii account is active, link your finance systems (for example, Coupa or QuickBooks). This sync will import QuickBooks charges into Torii so you can see its cost.
You can also upload contracts directly to Torii; their AI will pull out the subscription pricing automatically.
Here are more instructions for the QuickBooks integration.
3. Search for QuickBooks within Torii
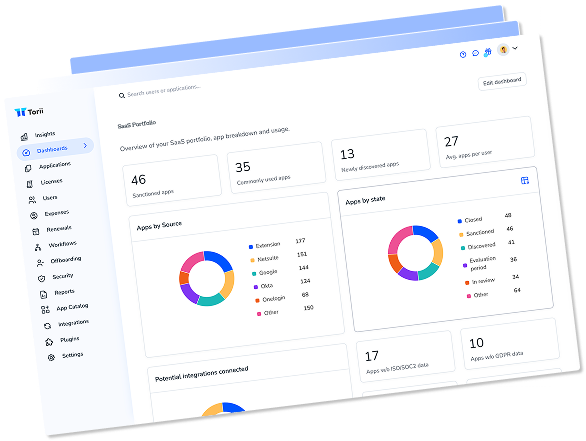
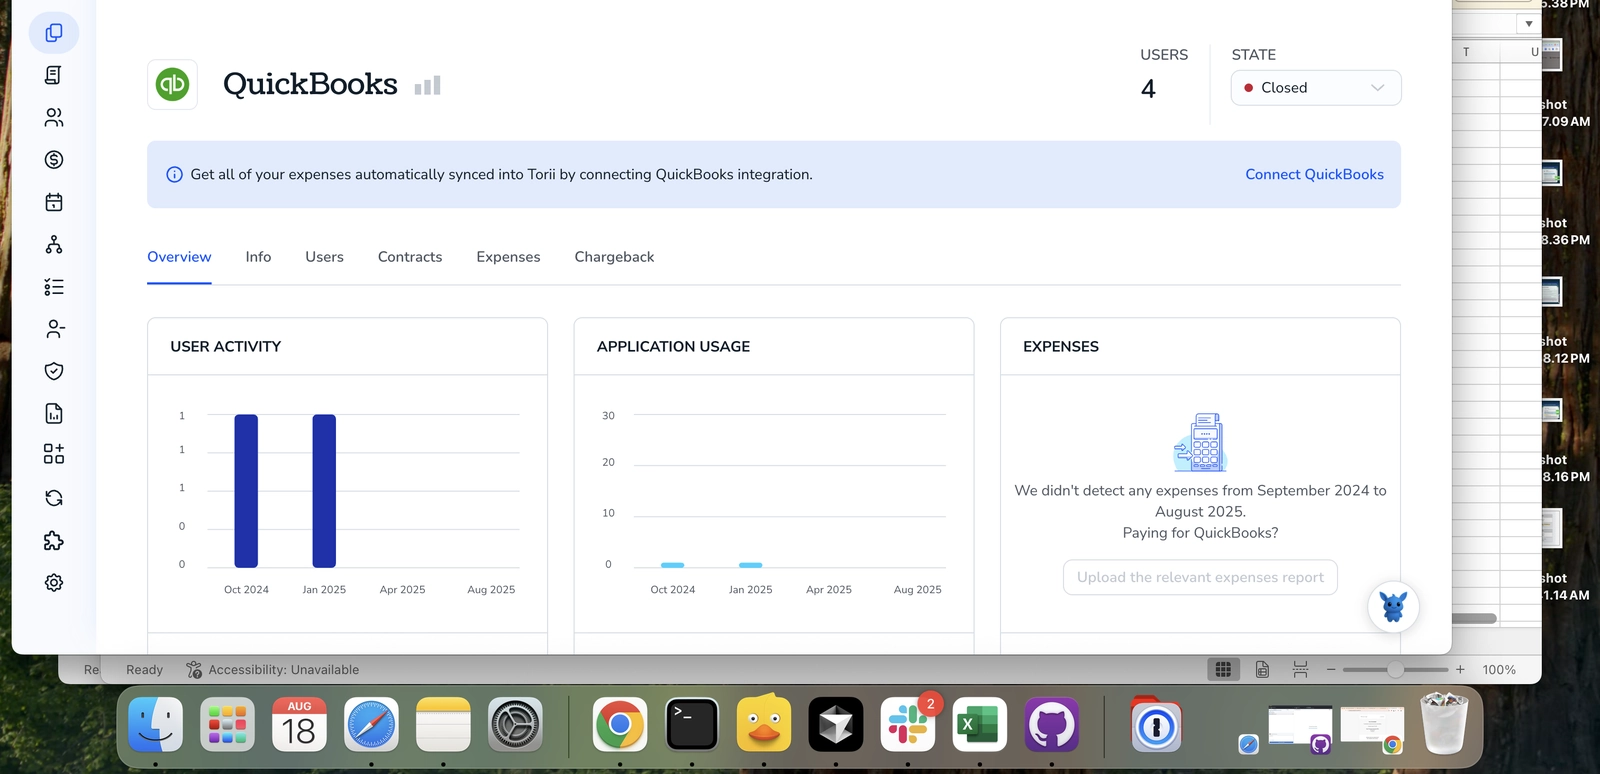
Use the search box at the top of the Torii dashboard to look up QuickBooks. That opens the QuickBooks app page in Torii, where you’ll find details like license counts, total spend, upcoming renewal dates, and more.

Or, chat with Eko
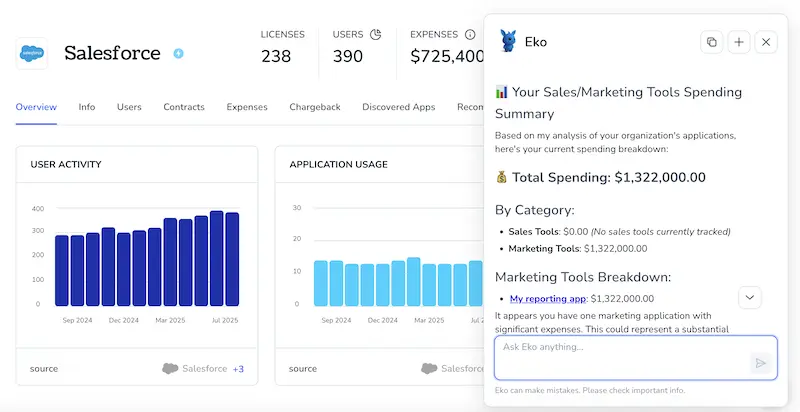
Torii’s AI helper, Eko, can retrieve QuickBooks data inside Torii using simple natural-language chat. Click the Eko icon in the bottom-right corner of the dashboard, ask for the QuickBooks information you need, and Eko will display the results in the chat window.
Use QuickBooks’s API
Here you’ll use QuickBooks Online’s API (the Reports endpoint) to pull a Profit & Loss for a one-year date range and read the “Total Expenses” value. This gives you the annual cost without touching the QuickBooks UI.
Prepare: have an OAuth2 access token and the company (realm) ID
- Your requests need:
- Authorization header:
Bearer <ACCESS_TOKEN> - The company realmId in the request path
Accept: application/json
- Authorization header:
Example curl is:
curl -X GET "https://quickbooks.api.intuit.com/v3/company//reports/ProfitAndLoss?start_date=2024-01-01&end_date=2024-12-31&accounting_method=Accrual" \
-H "Authorization: Bearer " \
-H "Accept: application/json"
Call the ProfitAndLoss report for the year
- Use the Reports endpoint and set
start_dateandend_dateto cover the 12-month period you want. - Include
accounting_methodif you need cash vs accrual results. - Optionally add
minorversionto match any recent API response shape changes.
Read the response and extract the expense total
- The JSON response includes a
Rowsobject containing multipleRowentries (income, expenses, totals). - Look for the row that labels the aggregated expenses. Typical markers to check:
- A
RowwhoseColDatatext equals “Total Expenses” or a grouped “Expenses” section. - The numeric value is usually in the last
ColDataentry for that row. - If the report was customized and no single “Total Expenses” row appears, sum rows under the Expenses group.
- A
Example minimal parsing in JavaScript (adjust to your language):
const resp = /* parsed JSON response from the Reports call */;
const rows = resp.Rows && resp.Rows.Row ? resp.Rows.Row : [];
let totalExpenses = null;
for (const r of rows) {
    const cols = r.ColData  [];
    const label = cols[0] && cols[0].value ? cols[0].value : '';
    const value = cols[cols.length - 1] && cols[cols.length - 1].value ? cols[cols.length - 1].value : null;
    if (label && /Total Expenses/i.test(label)) {
        totalExpenses = parseFloat(value.replace(/[^0-9.\-]/g, ''));
        break;
    }
}
// Fallback: sum individual expense lines if no "Total Expenses" row found
if (totalExpenses === null) {
    let sum = 0;
    for (const r of rows) {
        const cols = r.ColData  [];
        const label = cols[0] && cols[0].value ? cols[0].value : '';
        const value = cols[cols.length - 1] && cols[cols.length - 1].value ? cols[cols.length - 1].value : null;
        if (/Expense/i.test(label) && value) {
            sum += parseFloat(value.replace(/[^0-9.\-]/g, ''));
        }
    }
    totalExpenses = sum;
}
console.log('Annual total expenses:', totalExpenses);
Handle common API responses
- If you get 401, the access token likely expired. Use your OAuth2 refresh flow to get a new token and retry.
- If the report JSON shape is different, inspect
resp.Rowsto find whichRowholds totals; QuickBooks report responses can vary by minorversion and custom settings. - If you need cost of goods sold instead of total operating expenses, look for “Cost of Goods Sold” in the same report.
Tips and alternatives within the QuickBooks API
- If you want expenses broken down by account for the year, run the same ProfitAndLoss request and read the account-level rows under the Expenses section.
- For very specific transaction-level sums (checks, bills, purchases), use the Query endpoint and sum matching transactions by date and account, but that requires handling multiple transaction types.
That’s the path: request ProfitAndLoss for the year, find the Total Expenses row (or sum expense rows), and use the numeric value as your annual cost.
Use Claude (via MCP)
You can also retrieve this data directly from Claude using the Model Context Protocol (MCP). Claude is Anthropic’s conversational AI and an alternative to ChatGPT.
To pull annual cost from QuickBooks via Claude, do the following:
1. Set up Torii
Complete the earlier Torii steps to link your QuickBooks account with Torii.
Then open Settings and generate a new API key.
2. Set up MCP in Claude
See the Torii MCP instructions for details, and this blog post for background.
Install the Claude Desktop app, then add the following to your claude_desktop_config.json:
{
    "mcpServers": {
        "Torii MCP": {
            "command": "env",
            "args": [
                "TORII_API_KEY=YOUR_API_KEY",
                "npx",
                "@toriihq/torii-mcp"
            ]
        }
    }
}
Create that API key from Torii’s Settings page.
3. Chat with Claude
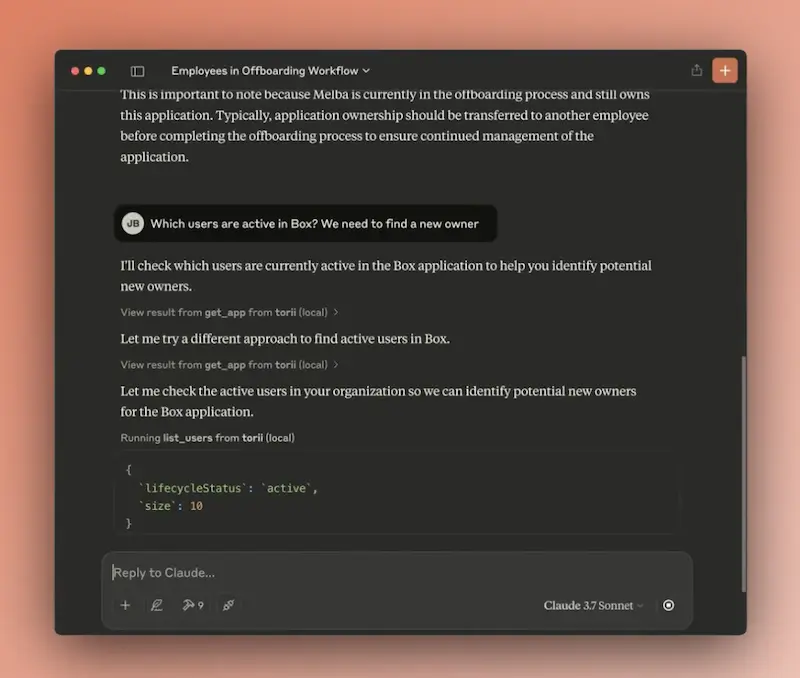
Once configured, Claude can query your Torii environment. Ask it to inspect QuickBooks and report things like total licenses, yearly spend, upcoming renewal dates, and other billing details.
Frequently Asked Questions
Open Reports, run Profit and Loss or Expenses by Vendor Summary, set the date range to last fiscal year, choose Total columns, then read the Total Expenses line. Export or save the report if you need documentation.
Run the Expenses by Vendor Summary report, click Customize, choose last year or custom dates, optionally filter to specific vendors, then run the report. Each vendor’s yearly spend plus a grand total appears instantly.
The Profit and Loss report is the fastest way. Set the period to Last Year, select Total Only columns, and QuickBooks displays a single Total Expenses figure that represents company-wide annual cost.
Call the QuickBooks Online Reports API for ProfitAndLoss with start_date and end_date covering 12 months. Parse the JSON response, find the Total Expenses row or sum expense rows, and return the annual figure programmatically.
Torii connects to QuickBooks, ingests charges and contracts, then shows license counts, yearly spend, and renewal dates in one dashboard. You avoid manual reports and can even chat with its AI helper Eko for quick numbers.
After linking Torii with QuickBooks and enabling the Model Context Protocol, ask Claude in plain language for yearly spend. Claude queries Torii, gathers QuickBooks expense data, and replies with totals, renewals, and other billing insights instantly.