4 Ways to Track Spending in Lucidchart in 2026

Trying to see where your cash disappears each month? Tables and bank app graphs help, but they rarely show the bigger picture. Lucidchart can map every dollar like a clear flow diagram you control.
Below, you’ll learn four simple ways to pull numbers into shapes, link data, and layer insights so patterns jump out fast. Pick one method or mix them; either way you’ll leave with a living dashboard you can tweak anytime.
Table of Contents
Use Lucidchart’s UI
Here, you’ll use Lucidchart’s own settings to keep tabs on what your team is spending.
1. Open the Admin Panel
- Sign in to Lucidchart.
- Open the hamburger menu in the top-left corner.
- Choose Admin Panel.
2. Go to Billing
On the left sidebar, pick Billing (older accounts may see Billing & invoices). This is the hub for every charge tied to your workspace.
3. Scan the Plan Summary
At the top of the page you’ll find a quick summary of your plan:
- Current plan name
- Cost per license
- Total licenses purchased
- Next renewal date and amount
This snapshot tells you if the spend matches what you expected.
4. Check Past Invoices
In the same area, scroll down until you reach the Invoices section.
- Every invoice is listed by date.
- Click Download to grab a PDF.
Match these against your finance records so surprises don’t slip through.
5. Compare License Usage
Still in the Admin Panel, jump to License Usage (sometimes listed under Users).
- See how many seats are assigned vs. Unassigned.
- If unassigned seats outnumber future hires, cut the extra licenses before renewal to trim costs.
6. Set Renewal Reminders (optional)
Above the invoice list, toggle Send renewal reminder and add the email addresses of anyone who needs a heads-up. A quick email nudge beats a last-minute scramble.
7. Export Data for Finance (optional)
If finance needs more detail, you can export the full dataset in seconds. In the upper-right corner of the Billing page, hit Export to download a CSV of all charges and license details. Hand it off to finance for their own analysis.
Use Torii
Tracking Lucidchart charges inside Lucidchart isn’t your only option; Torii offers an easier view. This SaaS management platform pulls every subscription you fund into one dashboard, so you can see spend, usage, and renewal dates together.
1. Sign up for Torii
Reach out to Torii and ask for a complimentary 14-day proof-of-concept account to kick things off.
2. Link your expense systems and upload agreements
Once your Torii workspace is active, connect finance tools you already use, such as Coupa or QuickBooks, so the platform can automatically pull Lucidchart transactions.
Simply drag and drop your contracts straight into the Torii workspace. Torii’s AI automatically scans each document and records the subscription price and term details for you.
See the detailed Lucidchart integration guide here.
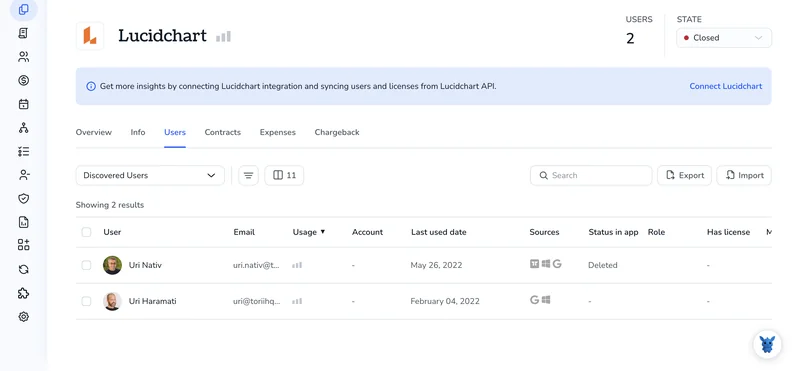
3. Locate Lucidchart inside Torii
Start by entering “Lucidchart” into the dashboard’s top-level search bar. Open the resulting Lucidchart app page to view license counts, total spend, upcoming renewal dates, and other account details.

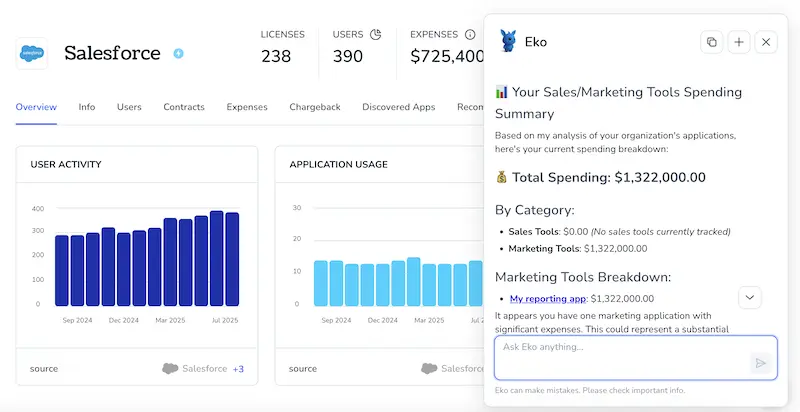
Or, chat with Eko
To find Lucidchart info in Torii, open the AI helper Eko. Click its icon in the dashboard’s bottom-right corner, ask for Lucidchart details, and the chat shows what you need.
Use Lucidchart’s API
Use these calls to pull live license and cost data from Lucidchart’s API and see the monthly burn in real time.
1. Grab an API access token
Every Lucidchart API request still needs a personal access token. Generate it in the admin panel and stash it somewhere safe.
Authorization: Bearer YOUR_TOKEN
2. Pull the subscription snapshot
This call lists every active subscription on the account, including price, renewal date, and seat count.
curl -X GET \
https://api.lucidchart.com/api/v1/subscriptions \
-H "Authorization: Bearer $TOKEN"
Save the JSON response locally so you can reuse it. You’ll see something like:
{
    "subscriptions":[
        {
            "id":"sub_123",
            "planName":"Lucidchart Enterprise",
            "billingCycle":"monthly",
            "seatPrice":12.0,
            "seatsPurchased":150
        }
    ]
}
3. Count seats that are in use
ask for the users who are assigned a paid license.
curl -X GET \
"https://api.lucidchart.com/api/v1/users?license=paid&max_results=500" \
-H "Authorization: Bearer $TOKEN"
The API responds with a JSON array named users for licensed accounts. The length of that array equals seats in use. Log the value:
import requests, os, json

headers = {"Authorization": f"Bearer {os.environ['TOKEN']}"}
resp = requests.get(
"https://api.lucidchart.com/api/v1/users?license=paid&max_results=500",
headers=headers)
paid_seats = len(resp.json()['users'])
print("Seats in use:", paid_seats)
4. Calculate current spend
Pull seatPrice and billingCycle from Step 2, then multiply by the seat count from Step 3.
monthly_cost = seatPrice * paid_seats
print(f"Estimated monthly cost: ${monthly_cost}")
5. Log and alert on overages
Run the script nightly with cron or with any scheduler. Push the numbers into a sheet or a lightweight database. When paid_seats comes within roughly 5% of seatsPurchased, send a chat or email so you can buy more seats, or remind idle users to free some up.
Use Claude (via MCP)
You can also pull these details inside Claude by using the Model Context Protocol (MCP). It’s Anthropic’s AI assistant and a solid alternative to ChatGPT.
To track Lucidchart spending through Claude, follow the steps below:
1. Connect Torii
Use the earlier Torii instructions to link your Lucidchart workspace with Torii. Completing this link lets Torii pull usage and cost data automatically, so later reports stay accurate without manual uploads.
Open Settings in Torii and generate a new API key. Keep it handy; you’ll paste it into the Claude config file in just a moment shortly.
2. Configure MCP in Claude
Refer to the official Torii MCP instructions and this related blog post. Both walk through the setup in much greater detail than this quick guide ever could.
Download the Claude Desktop application, then add the following snippet to your local top-level claude_desktop_config.json file:
{
    "mcpServers": {
        "Torii MCP": {
            "command": "env",
            "args": [
                "TORII_API_KEY=YOUR_API_KEY",
                "npx",
                "@toriihq/torii-mcp"
            ]
        }
    }
}
The API key referenced above is the same one you generated a moment ago in Torii’s Settings.
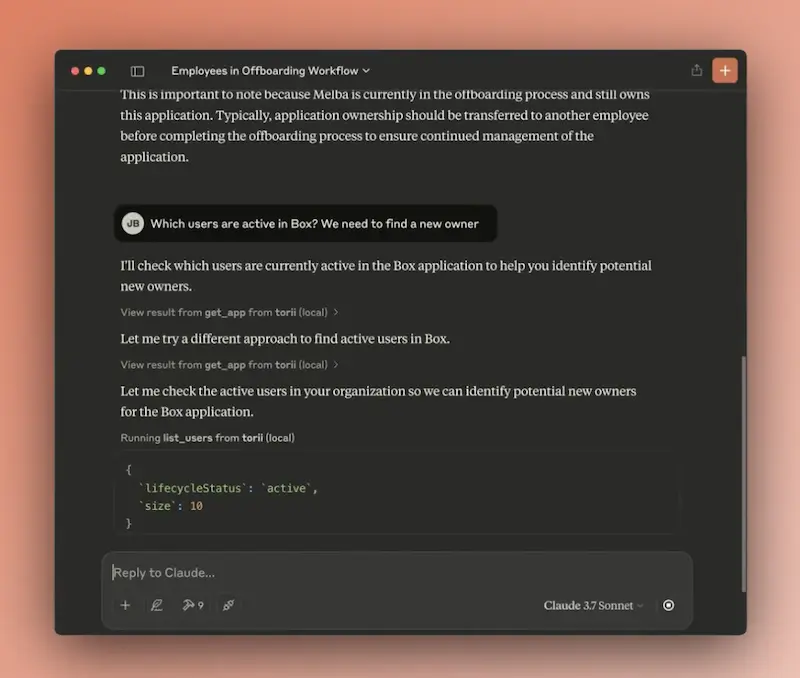
3. Talk to Claude
With everything connected, start a chat in Claude and interact with your Torii environment. For example, you can ask Claude to review your Lucidchart subscription, report license counts, total spend, upcoming renewal dates, and other useful insights.
Torii for SaaS Management
If you’re taking a closer look at SaaS management, Torii can show what’s possible and help you move faster. Torii’s SaaS Management Platform enables you to:
- Expose shadow apps: AI scans your environment around the clock and flags unapproved software the moment seems.
- Reduce spend: Reclaim budget by removing idle licenses across teams and consolidating overlapping tools into a single, agreed-upon stack.
- Automate employee lifecycle tasks: Run no-touch onboarding and offboarding workflows that save hours, prevent mistakes, and give employees a smooth transition.
- Receive renewal reminders: Get alerts well before each deadline so your team can review every contract before it auto-renews.
Torii delivers the first end-to-end SaaS management platform, giving Finance, IT, and Security one reliable source of truth.
Learn more about what Torii can do for your organization and see the platform in action by visiting Torii.
Frequently Asked Questions
You have four options to track Lucidchart spending and license usage—use the Billing and License Usage sections in the Admin Panel, connect the account to Torii for a single dashboard, call Lucidchart’s REST API, or chat with Claude via Torii’s MCP integration.
The Plan Summary shows your current subscription name, price per license, total seats purchased, next renewal date, and projected renewal amount, letting admins confirm whether charges, seat counts, and contract timing match internal budgets before digging into detailed invoices.
Torii automatically imports Lucidchart transactions, scans uploaded contracts, and displays spend, usage, and renewal dates in one view. Its AI flags idle seats, sends advance renewal alerts, and even answers chat questions, helping Finance and IT cut waste without manual spreadsheets.
Yes. By generating a personal access token you can call the /subscriptions endpoint for plan price and seat limits, then query /users with license=paid to count active seats. Combine the two responses to calculate real‑time costs and trigger automated overage alerts.
Inside the Lucidchart Admin Panel, open Billing, scroll to the Invoices section, toggle "Send renewal reminder," and add the coworkers’ email addresses. Lucidchart will email them well before the renewal date, preventing last‑minute surprises or accidental auto‑renewals.
After connecting Torii to Claude, add the Torii MCP server in your claude_desktop_config.json, then ask Claude questions such as "Show Lucidchart spend." Claude pulls live data from Torii, summarizing licenses, costs, and renewal timelines directly in the chat window.