3 Ways to Monitor Spending in Smartsheet

Tracking costs across multiple Smartsheet projects shouldn’t feel like guesswork. Budgets shift, vendors bill late, and scattered sheets make it hard to see where money goes. You need one view that ties spend to scope and schedule.
This guide shows three practical ways to monitor spending in Smartsheet, from granular line items to portfolio rollups. You’ll learn how to surface actuals vs. Budget, flag variances early, and keep stakeholders aligned, without rebuilding your process.
Table of Contents
Use Smartsheet’s UI
Here, you’ll use Smartsheet’s UI to set up a simple budget tracker, roll it up across work, and keep alerts on overspend.
Start with a budget-ready sheet
You can begin from scratch or from Smartsheet’s Project Budget template. The template gives you a working layout with cost columns and formulas.
- In Smartsheet, open the Solution Center, search for Project Budget, and create the sheet. Smartsheet’s docs: Solution Center and Templates.
- Rename it, pick a workspace, and set your currency format. Smartsheet’s docs: Column types and number/currency formatting.
Add the cost columns you need
Keep it simple first. You can always expand later.
- Add or confirm these columns:
- Task or Item (Primary column)
- Category (Dropdown, like Labor, Materials, Software)
- Planned Cost (Currency)
- Actual Cost (Currency)
- Variance (Text/Number)
- Percent Variance (Text/Number)
- To add a column, select the plus sign to the right of your columns and choose the type. Smartsheet’s docs: Column types; Edit column properties.
Enter formulas for variance and percent variance
Use column formulas so every new row calculates automatically. Smartsheet’s docs: Create and edit formulas; Column formulas.
In the first row of the Variance column, add:
=[Actual Cost]@row - [Planned Cost]@row
In the first row of Percent Variance, add:
=IFERROR(([Actual Cost]@row - [Planned Cost]@row) / [Planned Cost]@row, 0)
Right-Click each formula cell and select Convert to column formula.
Roll up totals with Sheet Summary
Sheet Summary fields are the easiest way to get totals and KPIs without sticky footer rows. Smartsheet’s docs: Use Sheet Summary fields.
- Open the Sheet Summary panel. Add these fields and formulas:
- Total Planned:
=SUM([Planned Cost]:[Planned Cost])
Total Actual:
=SUM([Actual Cost]:[Actual Cost])
Total Variance:
=[Total Actual]@row - [Total Planned]@row
Variance Percent:
=IFERROR([Total Variance]@row / [Total Planned]@row, 0)
Highlight overspend with conditional formatting
Set quick visuals so problem lines pop. Smartsheet’s docs: Conditional formatting.
- Open Conditional Formatting and add rules:
- If Variance is greater than 0, color the row light red.
- If Percent Variance is greater than 0.1, bold the row or color the text.
- Keep rules simple so teammates understand what they mean.
Group and summarize spending with a row report
Reports let you group by Category or Vendor and see totals at a glance. Smartsheet’s docs: Create row reports; Group, sort, and summarize a report.
- Create a new Row Report.
- Add your budget sheet as a source.
- Show columns you care about: Category, Planned Cost, Actual Cost, Variance.
- Group by Category or Vendor.
- In the Summaries pane, set Planned and Actual to Sum, and Variance to Sum.
Watch KPIs on a dashboard
Dashboards turn those totals into live, easy-to-scan widgets. Smartsheet’s docs: Build a dashboard; Add widgets to a dashboard; Chart widget; Metric widget.
- Create a new Dashboard.
- Add a Metric widget and point it at your Sheet Summary fields for Total Planned, Total Actual, and Total Variance.
- Add a Chart widget and point it at your Report to compare Actual vs Planned by Category.
- Keep labels clear and limit charts to what you’ll scan daily.
Get alerted when spend crosses a limit
Automations help you react fast without sifting through rows. Smartsheet’s docs: Create an automated workflow; Alert someone; Change-based triggers.
- Open Automation and create a workflow.
- Trigger: When rows are changed.
- Condition: Variance greater than 0 or Percent Variance greater than your threshold.
- Action: Alert someone. Choose recipients and customize the message. Include row fields like Task, Category, Planned, Actual, and Variance.
Roll up spending across multiple projects with a Summary Report
If teams track costs in separate sheets, pull their Sheet Summary fields into one portfolio view. Smartsheet’s docs: Create a Summary Report.
- Create a Summary Report.
- Choose the workspace or folder that holds your budget sheets.
- Select the Sheet Summary fields to include: Total Planned, Total Actual, Total Variance.
- Group by Project Name or Owner, and add Sum summaries.
- Use this report as the data source for portfolio charts on a dashboard.
Lock what matters and share the sheet
Keep formulas and structure safe, and share widely so people update their parts. Smartsheet’s docs: Lock rows and columns; Share a sheet.
- Lock columns with formulas like Variance and Percent Variance.
- Share the sheet and report with the right permissions:
- Editors can update Actual Cost.
- Admins can edit structure and formulas.
Tips that save time:
- Use dropdowns for Category and Vendor so reports group cleanly.
- Keep one source of truth for Actual Cost. If it lives in another sheet, use cross-sheet formulas with clear cell references. Smartsheet’s docs: Formulas using cross-sheet references.
- Reuse your dashboard by pointing it at different reports or summary fields per project.
Use Torii
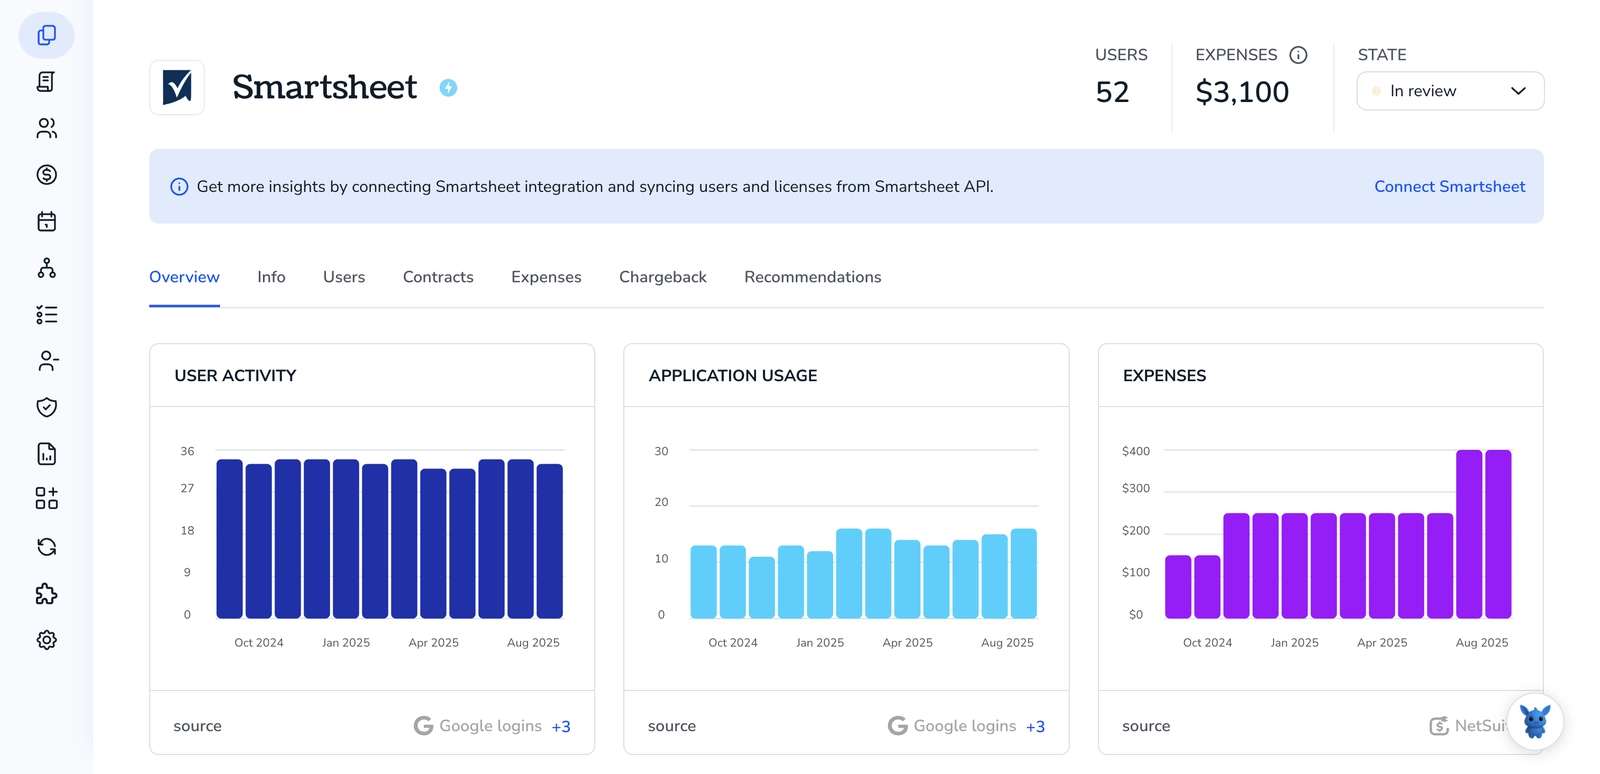
Instead of working directly in Smartsheet, you can rely on Torii, a SaaS Management Platform, to track Smartsheet spend. SMPs give teams a centralized place to manage SaaS subscriptions and integrations, making it easy to programmatically onboard/offboard users, review subscription details, and more.
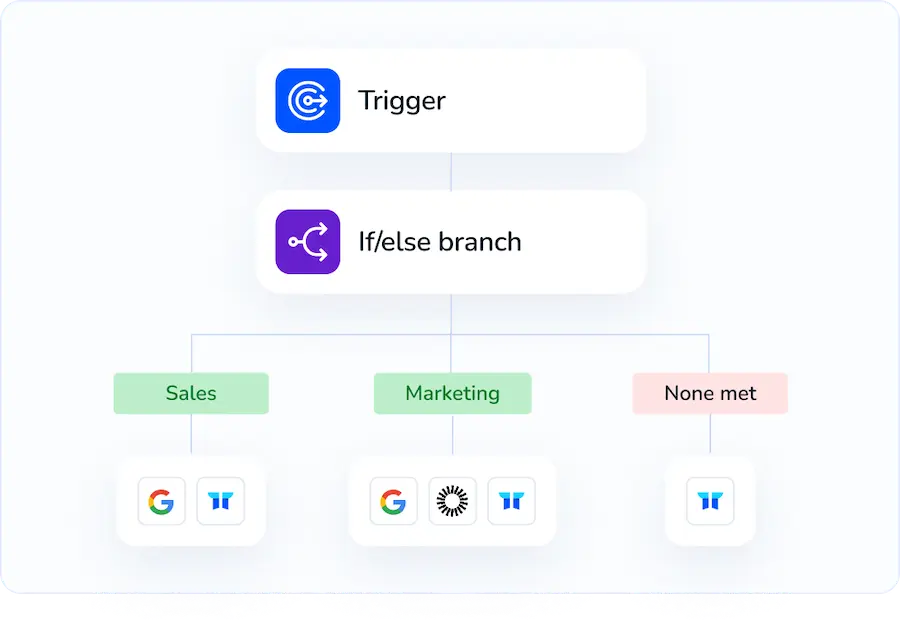
Unlike the manual steps you might take in Smartsheet, Torii lets you automate the workflow so actions run as soon as a specified trigger occurs. Triggers can include a new hire, a departing employee, a contract renewal, and similar events. If this task repeats often, automation can save considerable time.
To keep an eye on Smartsheet spending directly from Torii, follow these steps:
1. Sign up for Torii
Contact Torii, and request your free two-week proof-of-concept.
2. Connect your Smartsheet account to Torii
After your account is active, connect Smartsheet to Torii (assuming you already have an account). Here are the instructions for the Smartsheet integration.
3. Create a Torii workflow for Smartsheet
In Torii, you can build automated workflows to monitor Smartsheet spend. Go to the Workflows tab, configure a trigger, and then add an action that tracks spending in Smartsheet. From then on, whenever the trigger fires, the monitoring will run automatically.
Use Smartsheet’s API
Here, you’ll use the Smartsheet API to pull spend data from a sheet, calculate totals, and keep a running summary up to date. No UI clicks. Just API calls.
Get ready: authenticate and find your budget sheet
You’ll need a Smartsheet access token with access to the sheet that stores spend.
Set an environment variable for your token:
export SMARTSHEET_TOKEN=your_token_here
List sheets and find the one that holds your spend data:
Example curl is:
curl -s \
-H "Authorization: Bearer $SMARTSHEET_TOKEN" \
https://api.smartsheet.com/2.0/sheets
If you prefer search by name:
Example curl is:
curl -s \
-H "Authorization: Bearer $SMARTSHEET_TOKEN" \
"https://api.smartsheet.com/2.0/search?query=budget"
Note the sheetId you’ll use next.
Map column names to column IDs
You’ll compute totals by reading cells. Cells reference columns by ID, so map your spend columns (for example Amount, Category, Vendor, Date) to IDs first.
Example curl is:
curl -s \
-H "Authorization: Bearer $SMARTSHEET_TOKEN" \
"https://api.smartsheet.com/2.0/sheets/{sheetId}?includeAll=true"
Quick Node.js snippet to build a column map by name:
const fetch = require('node-fetch');
async function getColumnMap(sheetId, token) {
    const res = await fetch(`https://api.smartsheet.com/2.0/sheets/${sheetId}?includeAll=true`, {
        headers: { Authorization: `Bearer ${token}` }
    });
    const sheet = await res.json();
    const map = {};
    for (const col of sheet.columns) map[col.title] = col.id;
    return map; // e.g., map['Amount'] -> 1234567890
}
Pull rows and calculate spend totals
Grab all rows, then sum the Amount column. If your Amount column is Currency, use cell.value. It’s numeric even if display shows a currency symbol.
Fetch all rows:
Example curl is:
curl -s \
-H "Authorization: Bearer $SMARTSHEET_TOKEN" \
"https://api.smartsheet.com/2.0/sheets/{sheetId}?includeAll=true"
Calculate totals in code:
function sumSpend(sheetJson, amountColId, filters = {}) {
    // Optional filters:
    // filters.category -> only include a given category
    // filters.vendor -> only include a given vendor
    // filters.status -> only include a given status (if you track it)
    let total = 0;
    for (const row of sheetJson.rows) {
        const cells = Object.fromEntries(row.cells.map(c => [c.columnId, c]));
        const amountCell = cells[amountColId];
        if (.amountCell  typeof amountCell.value .== 'number') continue;
        let keep = true;
        if (filters.category && .row.cells.find(c => (c.displayValue  c.value) === filters.category)) keep = false;
        if (filters.vendor && .row.cells.find(c => (c.displayValue  c.value) === filters.vendor)) keep = false;
        if (filters.status && .row.cells.find(c => (c.displayValue  c.value) === filters.status)) keep = false;
        if (keep) total += amountCell.value;
    }
    return total;
}
Tip:
If your sheet is large, use pagination:
Example curl is:
curl -s \
-H "Authorization: Bearer $SMARTSHEET_TOKEN" \
"https://api.smartsheet.com/2.0/sheets/{sheetId}?pageSize=500&page=1"
Store or read totals with Sheet Summary fields
If you already keep totals in Sheet Summary, read them. If not, create fields like Total Spend and update them on each run.
Read summary:
Example curl is:
curl -s \
-H "Authorization: Bearer $SMARTSHEET_TOKEN" \
"https://api.smartsheet.com/2.0/sheets/{sheetId}/summary"
Create summary fields (for example Total Spend and MTD Spend):
Example curl is:
curl -s -X POST \
-H "Authorization: Bearer $SMARTSHEET_TOKEN" \
-H "Content-Type: application/json" \
-D '{
    "fields": [
        { "title": "Total Spend", "type": "TEXT_NUMBER", "value": 0 },
        { "title": "MTD Spend", "type": "TEXT_NUMBER", "value": 0 }
    ]
}' \
"https://api.smartsheet.com/2.0/sheets/{sheetId}/summary/fields"
Update summary fields after you compute totals. You’ll need the field IDs from the read summary response:
Example curl is:
curl -s -X PUT \
-H "Authorization: Bearer $SMARTSHEET_TOKEN" \
-H "Content-Type: application/json" \
-D '{
    "fields": [
        { "id": 111111111111111111, "value": 45832.19 },
        { "id": 222222222222222222, "value": 17340.55 }
    ]
}' \
"https://api.smartsheet.com/2.0/sheets/{sheetId}/summary/fields"
Notes:
- Summary field type for numbers is TEXT_NUMBER. Currency formatting is a display choice; the stored value is numeric.
- You can also use formulas in summary fields, for example
=SUM([Amount]:[Amount]), if you prefer Smartsheet to calculate totals.
Keep it live with a webhook
Use webhooks so your totals refresh when rows change.
Create a webhook scoped to your sheet:
Example curl is:
curl -s -X POST \
-H "Authorization: Bearer $SMARTSHEET_TOKEN" \
-H "Content-Type: application/json" \
-D '{
    "name": "Budget Sheet Spend Monitor",
    "callbackUrl": "https://your.api.example.com/smartsheet/hooks",
    "scope": "sheet",
    "scopeObjectId": 123456789012345678,
    "events": ["*.*"],
    "version": 1
}' \
"https://api.smartsheet.com/2.0/webhooks"
- Verify the webhook challenge:
- Smartsheet sends a POST to your callback with a Smartsheet-Hook-Challenge header.
- Respond with HTTP 200 and the same value in a Smartsheet-Hook-Response header.
- Store the Smartsheet-Hook-Secret header value from that request. You’ll use it to validate future notifications.
Example Node.js express-style handler:
app.post('/smartsheet/hooks', express.text({ type: '*/*' }), (req, res) => {
    const challenge = req.header('Smartsheet-Hook-Challenge');
    const secret = req.header('Smartsheet-Hook-Secret');
    if (challenge) {
        // Save secret securely for HMAC checks on future events
        saveSecretSomewhere(secret);
        res.set('Smartsheet-Hook-Response', challenge);
        return res.status(200).send();
    }
    // For event deliveries, validate signature
    const sig = req.header('Smartsheet-Hmac-SHA256');
    const expected = crypto.createHmac('sha256', getSavedSecret())
    .update(req.body)
    .digest('base64');
    if (sig .== expected) return res.sendStatus(400);
    // Process events.
    QueueRecalc(JSON.parse(req.body));
    res.sendStatus(200);
});
Recalculate on webhook events and update summary
When you receive an event, you can fetch only the changed rows or just recompute everything. For smaller sheets, full recompute is simple and safe.
Option A. Fetch only changed rows: Parse the event payload for row IDs, then:
Example curl is:
curl -s \
-H "Authorization: Bearer $SMARTSHEET_TOKEN" \
"https://api.smartsheet.com/2.0/sheets/{sheetId}/rows?ids=111111111111111111,222222222222222222"
Option B. Recompute totals from the whole sheet:
Example curl is:
curl -s \
-H "Authorization: Bearer $SMARTSHEET_TOKEN" \
"https://api.smartsheet.com/2.0/sheets/{sheetId}?includeAll=true"
Update your summary fields with the new totals (same PUT call as above).
Add practical filters for better monitoring
You can calculate different views with the same sheet data, then write each to its own summary field:
- Common filters:
- Current month spend
- By vendor
- By category
- Pending vs approved spend (if you track status)
Example: filter month-to-date by checking a Date column in code before adding to the total.
Quick end-to-end script outline
This simple flow runs anywhere you can host code:
- Fetch sheet and build column map.
- Compute totals you care about.
- Create summary fields if missing; then update values.
- Create webhook and verify it.
- On events, validate HMAC, recompute, update summary.
That’s it. You’re monitoring spend through the Smartsheet API, keeping totals accurate without touching the UI.
Frequently Asked Questions
You have three options: use Smartsheet UI, Torii, or the Smartsheet API. Use the UI for templates, Sheet Summary, reports and dashboards; Torii for automated SaaS tracking and workflows; API for programmatic totals, summary fields and webhooks to keep numbers live.
Start from the Project Budget template or a blank sheet, add columns (Task, Category, Planned, Actual, Variance, Percent Variance), enter column formulas, convert them to column formulas, then use Sheet Summary for rollups and KPIs.
Create a Summary Report that pulls Sheet Summary fields (Total Planned, Total Actual, Total Variance) from each project workspace or folder. Group by project or owner, sum fields, and use that report as a dashboard data source for portfolio charts and metrics.
Build an automated workflow: trigger on row changes, add a condition (Variance > 0 or Percent Variance above a threshold), and send alerts to recipients. Include key fields in the message and assign editors to update Actual Cost; adjust thresholds to reduce noise.
Sign up for Torii and connect your Smartsheet account. Build workflows that trigger on hires, departures, or renewals to automatically monitor subscriptions and spend. Use Torii dashboards and integrations to centralize SaaS costs and reduce manual tracking across sheets.
Use the Smartsheet API to read sheets, map column IDs, compute totals, and create/verify a webhook. On events validate HMAC, fetch changed rows or recompute, then PUT updated values to Sheet Summary fields so dashboards and reports stay current.